by Luke Greiner
December 2015
Minnesota's share of public employment is at its lowest level in at least 10 years with 13.6 percent of all covered employment found in federal, state, and local government. Typically the share of public sector employment swells during economic downturns as private sector employers shed jobs and the need for government services increases. During an economic expansionary period the inverse occurs. Minnesota exhibits a classic example of a changing share of jobs held by public sector employment as the economy swings. Government employment is primarily local government which has 70.8 percent of all government employment. State government has 20.8 percent, and federal employment is 8.4 percent of the total government employment figure. Local government is primarily education which accounts for just over 50 percent of its figure. Public Administration is second with just under 33 percent, and Healthcare and Social Assistance is third with just over 5 percent. These three cover just over 88 percent of local government employment.
From 2007 to 2010 Minnesota's private sector employment shed 128,013 jobs, dropping 5.5 percent while government employment remained relatively stable and increased by 2,998 or 0.8 percent. Government's share of total employment reached 14.6 percent in 2010, up from 13.8 percent leading into the downturn in 2007. The education sector was the largest contributor to public sector employment growth during the recession from an increase of 3,283 jobs or 2 percent. Declining private sector employment also increase the percent of the public sector's share.
Since the recession ended in 2010 government employment has declined by 1,886 jobs (0.5 percent) and remains at 372,051 jobs or 13.6 percent of covered employment in 2014. The largest losses in government jobs from 2010 to 2014 were found in the arts, entertainment, and recreation industry which shed some 1,892 jobs (16.8 percent). This industry includes jobs in government operated parks, museums, zoos, and casinos. Education employment stayed fairly steady since it is based on population.
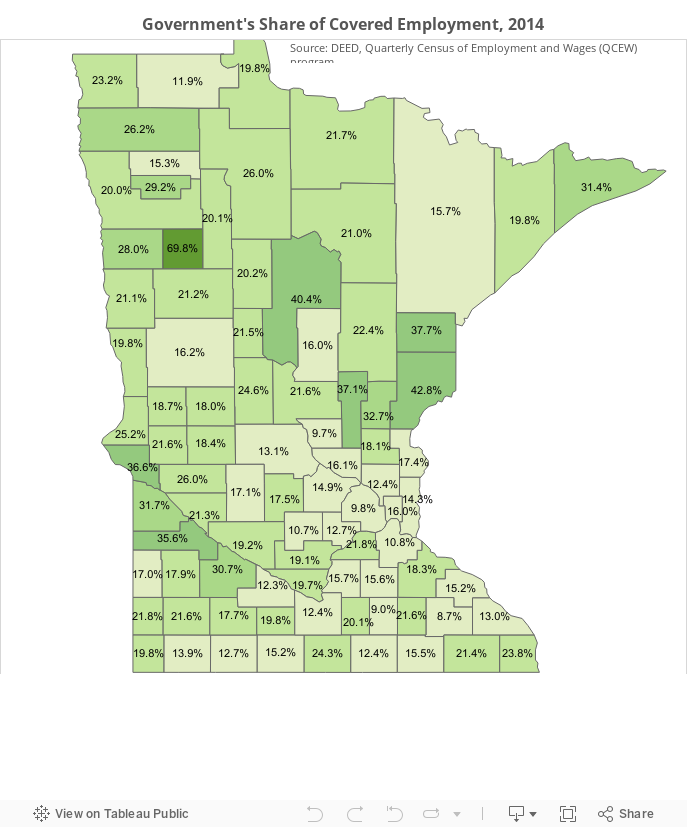
Although Minnesota's economy is expanding and continues to add private sector jobs while decreasing the share of jobs in government, many counties don't follow suit.
During the Recession (2007-2010): Carlton County's share of government employment increased 4.8 percentage points, more than any other county. Clearwater County's share of government employment experienced the largest decline, decreasing 2.9 percentage points during the recession. Carlton County has a casino, Clearwater County doesn't.
Since the recession (2010-2014), Traverse County saw the largest decrease in the share of government employment, dropping a whopping 13.6 percentage points, while neighboring Big Stone County saw the largest gain at 3.4 percentage points.
DEED's Quarterly Census of Employment and Wages (QCEW) program provides specific information about what type of government employment your county has. QCEW uses a census of employers showing employment and wages that are covered under the Unemployment Insurance Program. Data are available by industry, ownership type, state, regions, counties, and minor civil divisions.
To find the QCEW data tool from DEED's home page, select the gray data tab on the left side of the screen in the dropdown select Data Tools then select Quarterly Census of Employment and Wages to produce Minnesota All Ownerships and Private in the most recent year by supersector. To change the area or see more specific industries, click the "start over" link at the top right of the screen.
The first selection defines the geography to be used. Holding the control button allows for multiple selections.
1b. Clicking next on an alphabetical list of the available cities, counties, and regions. Again, users can select multiple geographic regions by holding control while making selections.
The next option sets the year of data. QCEW data typically take about six months to verify and clean errors before it can be published online, and data are available on DEED's website back to 2000. Selecting multiple years can allow for more nearly accurate time series analysis.
Government employment, whether it is local, state, or federal, will be organized by industry according to the North American Industrial Classification (NAICS). For instance, employment for a city parks and recreation department would be classified under arts, entertainment, and recreation (NAICS 71). The public administration industry (NAICS 92) includes government employment such as courts, firefighting and police protection, and the administration for various agencies and departments.

Industry selections can be made by selecting all 11 supersector industries for broad categories, all 20 industry sectors, or by manually selecting specific industry subsectors to view the most detailed information available.
Unlike private employment which can be suppressed to protect the identity of employers, government employment does not need to be suppressed. This allows users to see very detailed industry subsector employment for even small geographies such as cities and towns.
To select industry subsectors click the plus symbol next to the industry to view subsectors.
More information about NAICS classifications can be found on the Census website.
Results are found in a table with employment (jobs) as the default. Other tabs include establishments, wages (total payroll), average weekly wages, and other business employment dynamic data.
Use annual average data to reduce the seasonal employment variation.

Select your county on the map below to see how the share of government employment relative to all jobs has changed!