by Cameron Macht
November 2016
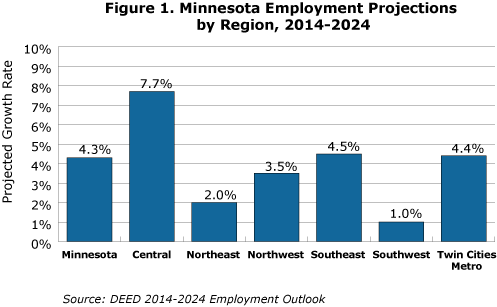
Minnesota is projected to add 130,000 new jobs over the next decade as employers statewide continue to expand. However, the job growth is not expected to be spread evenly across the state, with some regions seeing more and faster growth than others. Regional projections were just released, with growth rates ranging from 1.0 percent in Southwest to 7.7 percent in Central Minnesota (see Figure 1).

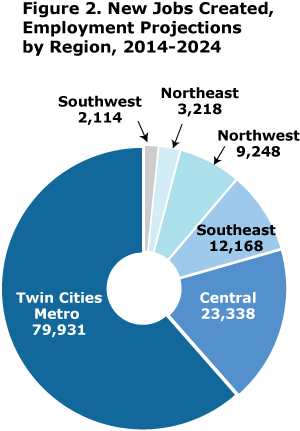
As the fastest growing region of the state, Central is expected to add over 23,000 jobs from 2014 to 2024. However, the lion’s share of the new job growth is projected to occur in the 7-County Twin Cities metro area. With nearly 80,000 new jobs, the Twin Cities could account for 61.5 percent of the net job growth forecast in the state, while Central would contribute 18 percent (see Figure 2).

Southeast may add just over 12,000 jobs, and Northwest is expected to gain about 9,250 jobs. The opposite ends of the state - Southwest and Northeast - are projected to see the smallest amount of job growth, partly caused by labor force constraints brought on by an aging population.
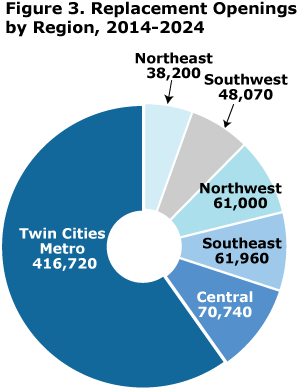
The upcoming and on-going retirements of baby boomers will lead to much slower labor force growth across the state. Raising participation rates for these older workers, Millennials, and a more diverse population will be key to filling the almost 700,000 projected replacement openings in the state – jobs that become available when experienced workers leave an occupation to start working in another occupation, stop working altogether, or move away.
Even with the youngest workforce, the Twin Cities will still have over 415,000 replacement openings, which is just under 60 percent of the state total. The Central, Southeast, and Northwest regions could all have over 60,000 replacement openings, each comprising about 10 percent of the projected replacement jobs. With the highest percentage of workers aged 55 years and over, both Southwest and Northeast will still have great replacement demands, despite not seeing much new growth (see Figure 3).

Detailed occupational and industry employment projections for Minnesota’s regions.
1Senf, Dave. “Minnesota Job Outlook to 2024.” June 2016.