by Dave Senf
August 2016
Note: All data except for Minnesota’s PMI have been seasonally adjusted. See the feature article in the Minnesota Employment Review, May 2010, for more information on the Minnesota Index.
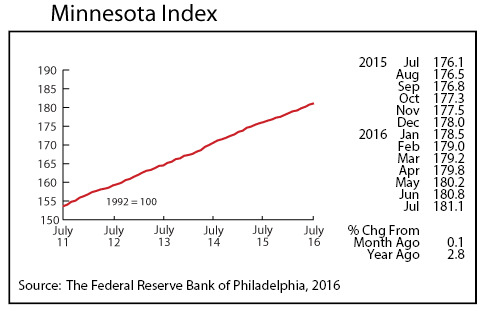
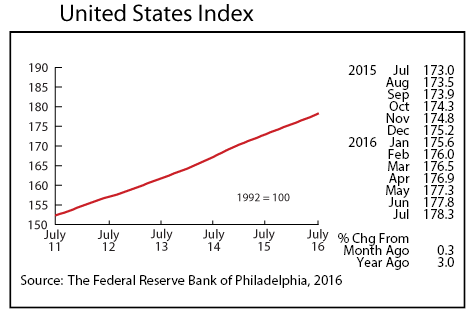
The Minnesota Index, after climbing 0.3 percent in June, downshifted in July, advancing by 0.1 percent. Two of the index’s components were negative in July as the state’s unemployment rate ticked up for the first time since February while average weekly manufacturing hours declined. The U.S. Index increased 0.3 percent for the second straight month in July.
Minnesota’s index is up 2.8 percent from a year ago while the U.S. index is up 3.0 percent. Minnesota’s average over-the-year gain since 1980 is 2.8 percent which is slightly higher than the U.S. 2.5 percent average. Minnesota’s average over-the-year growth as measured by the Minnesota Index between 2011 and 2015 was 3.4 percent compared to the average U.S. growth of 3.1 percent. The Minnesota index has average 2.8 percent through the first seven months of 2016 which is slightly behind the 3.0 percent averaged nationally.
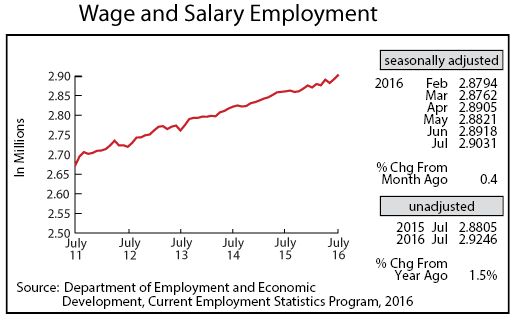
Minnesota’s adjusted Wage and Salary Employment ended its zigzagged pattern of declining in odd months and increasing in even months in July as employment increased robustly for the second month in a row. July’s job gain of 11,300 jobs was the second highest monthly increase over the last two years. All supersectors added to their payroll numbers except for Manufacturing and Mining and Logging. The big job creators were Leisure and Hospitality, Trade, Transportation, and Utilities, Other Services, and Educational and Health Services.
Minnesota’s year-over-year job growth rate increased to 1.5 percent, just short of the 1.7 percent increase recorded nationally. The gap between U.S. year-over-year job growth and Minnesota’s job growth hasn’t been this small since April 2015. Minnesota has added 27,400 jobs on a seasonally adjusted basis since last December which is just below the 27,600 added during the same period in 2015 and higher than the 25,400 jobs added during the first seven months of 2014.
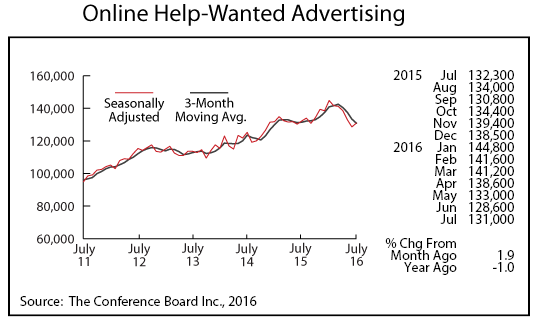
Online Help-Wanted Ads recorded their first increase in six months in July, rising to 131,000. July’s 1.9 percent increase in Minnesota lagged behind the U.S. 3.4 percent increase. Minnesota’s share of U.S. online help-wanted ads continues to be disproportionately high. Minnesota accounted for 2.01 percent of U.S. wage and salary employment in July but 2.72 percent of U.S. online help-wanted ads. Minnesota employers either advertise for help online more than other U.S. employers or the demand for labor in Minnesota is higher than nationally if online help-wanted ads are a reliable proxy for labor demand.
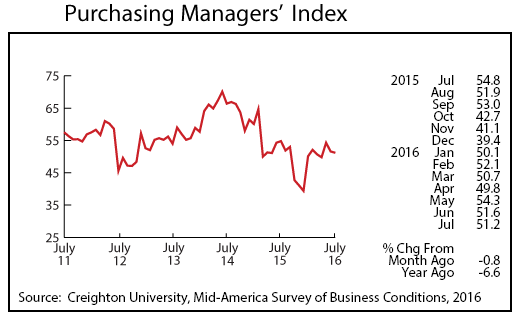
Minnesota’s Purchasing Managers’ Index (PMI) dipped for the second month in a row in July, slipping slightly to 51.2. July’s reading indicates moderate economic expansion for the state over the next few months. Creighton University’s Mid-American Business Conditions Index, a leading economic indicator for nine-states including Minnesota, dropped to 47.6 in July. The corresponding national index, the PMI (Purchasing Managers’ Index) produced by the Institute for Supply Management, declined to 52.6 last month.
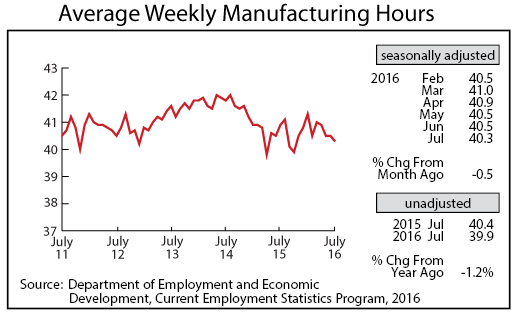
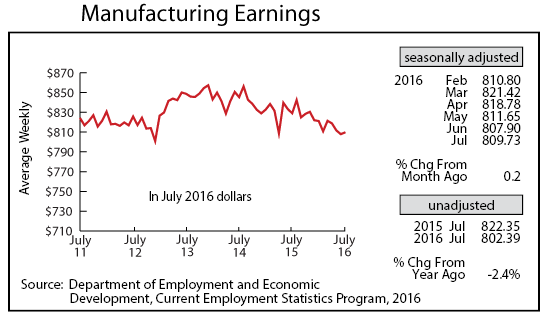
Adjusted Manufacturing Hours slid for the third time in the last four months in July. The 40.3 hour factory workweek in July was the shortest since last October. Average weekly Manufacturing Earnings inched up to $809.73 in July, but factory paychecks have been on a downward trend since 2013. Real manufacturing earnings average $846 per week in 2013 but only $814 so far this year. That is a 3.8 percent decline in average weekly factory paychecks.
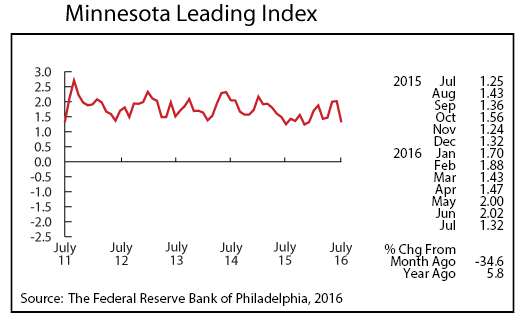
The Minnesota Leading Index, which last month was pointing toward 2 percent growth in Minnesota’s economy over the next six months, dropped to 1.3. July’s lower reading suggests continued economic growth in Minnesota through the rest of the year but at a slower pace than previously predicted.
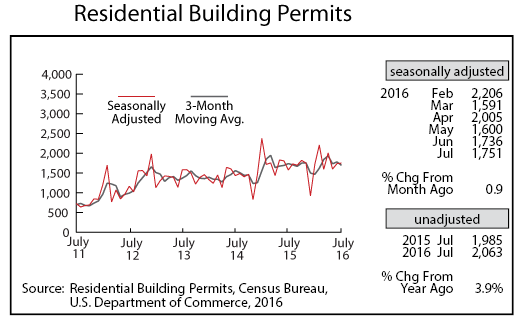
Adjusted Residential Building Permits were basically flat in July, increasing by just 15 permits from June. Housing permits through July are up only 0.8 percent on an unadjusted basis from 2015 as the home-building market in Minnesota continues its uneven rebound from the 2004 – 2009 bust.
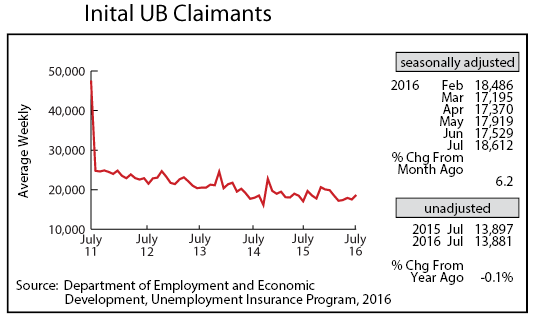
Adjusted Initial Claims for Unemployment Benefits (UB) jumped to 18,612, the highest level since January. Initial claims, which are usually considered to be a proxy for the rate of layoffs, continues to remain extremely low by historic standards. The low level of initial claims points to another year of solid job growth. Through the first seven months this year, annual average job growth (year-over-year) is averaging 1.3 percent, slightly below last year’s 1.5 percent annual average.
