by Dave Senf
November 2016
Note: All data except for Minnesota’s PMI have been seasonally adjusted. See the feature article in the Minnesota Employment Review, May 2010, for more information on the Minnesota Index.
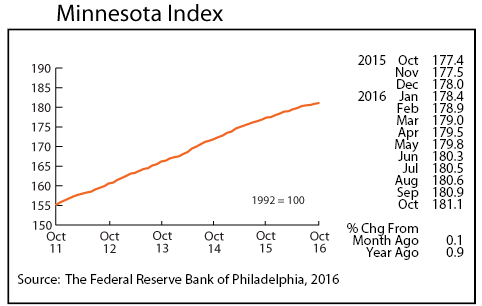
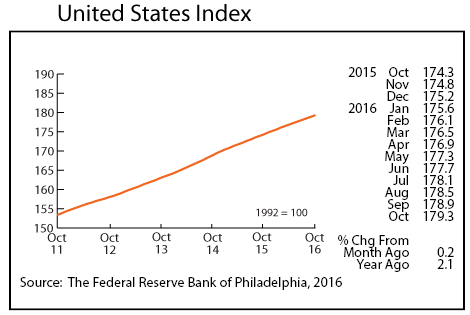
The Minnesota Index advanced by only 0.1 percent for the third time in the last four months in October. The index increased 0.21 percent monthly during the first half of 2016 after averaging 0.25 percent monthly gains in 2015. Since July the index has only managed to advance by 0.11 percent monthly. A steep drop in wage and salary employment along with a decline in average weekly manufacturing hours slowed the index. The state’s unemployment rate was 4.0 percent for the third consecutive month. A year ago unemployment in Minnesota was at 3.6 percent, a 15-year low. The U.S. Index climbed 0.2 percent for the 11th month in a row in October. Minnesota’s 0.11 percent average monthly increase over the last four months is half the 0.22 percent average monthly increase recorded nationally.
Minnesota’s index was up 2.1 percent from a year ago while the U.S. index was up 2.9 percent since October 2015. The Minnesota index’s over-the-year increase hasn’t been this low since September 2010. The Minnesota index hasn’t lagged behind the U.S. index by this much since March 2010.
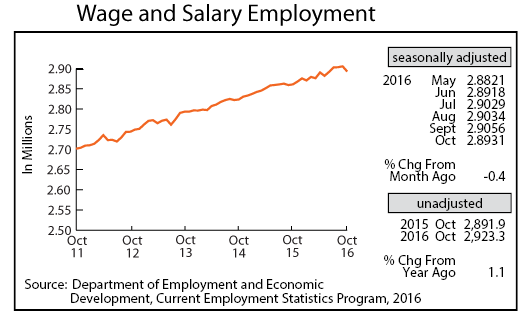
Minnesota’s adjusted Wage and Salary Employment recorded a steep drop in October with 12,500 jobs lost. The decline swept out most of the July through September job growth and was the largest monthly job drop since July 2013. Hopefully some of October’s cutbacks will be revised away in November. Job loss was widespread with all private supersectors cutting their payroll numbers.
The only growth in jobs was in the Government sector which added 200 jobs. The 12,700 private sector job cutback was the largest private job cutback since April 2009. Job loss was heavy in Leisure and Hospitality, Trade, Transportation, and Utilities, Professional and Business Services, and Educational and Health Services. Minnesota Manufacturers also cut jobs, laying off 1,300 workers. Minnesota’s over-the-year job growth dipped to 1.1 percent compared to 1.6 percent nationally.
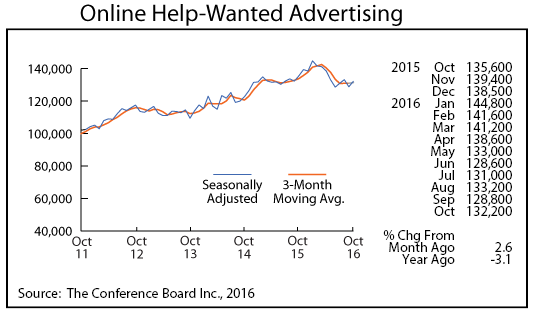
Online Help-Wanted Ads reversed directions in October, climbing to 132,200. Minnesota online job postings increased 2.6 percent in October, slightly ahead of the U.S. 2.5 percent increase. Minnesota’s share of nationwide online help-wanted ads remains disproportionately high at 2.7 percent since the state accounts for only 2.0 percent of national wage and salary employment. Minnesota’s online job advertising was slightly below a year ago for the fourth month in a row.
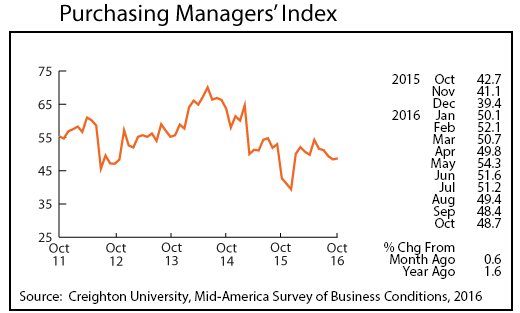
Minnesota’s Purchasing Managers’ Index (PMI) ticked up slightly in October to 48.7 but remained below the growth neutral 50 reading, implying that Minnesota’s manufacturers will experience little if any growth over the next few months. The Mid-American Business Conditions Index, a leading economic indicator for nine states including Minnesota, slipped again to 43.8. The corresponding national index inched up to 51.9 in October, indicating that manufacturers nationwide are expanding unlike Minnesota and other manufacturers in the Midwest.
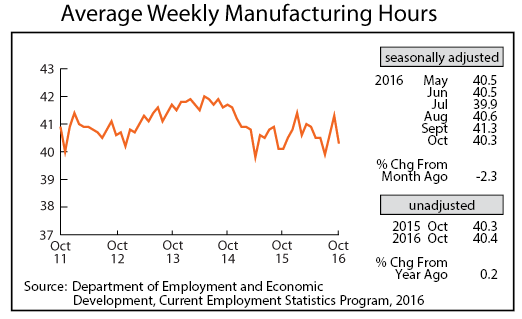
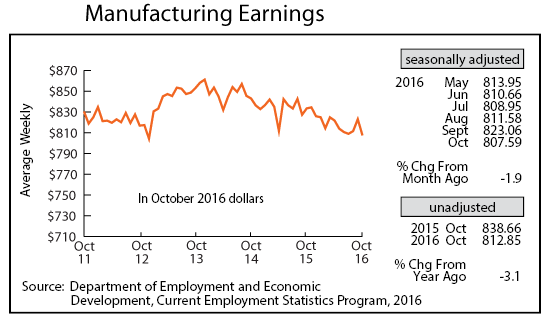
Adjusted Manufacturing Hours, after staging a comeback over the previous two months, nosedived by an hour in October to 40.3 hours. The hour drop was the largest since April 2015. Average weekly Manufacturing Earnings also slipped in October, slumping to $807.59, the lowest paycheck in nearly four years. Average weekly manufacturing earnings, adjusted for inflation and seasonality, were 3.1 percent below last year’s levels. This has been the case for all but one month over the last 26 months.
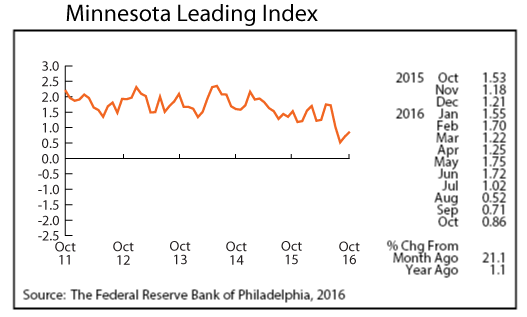
The Minnesota Leading Index rebounded a bit again in October, but the 0.86 remains significantly below the 1.5 average reading during the first half of the year. The 0.86 reading implies that Minnesota’s economy will grow by less than 1 percent over the next six months which is roughly half the growth rate achieved in 2015. This index is subject to substantial revisions as updated employment and unemployment data become available.
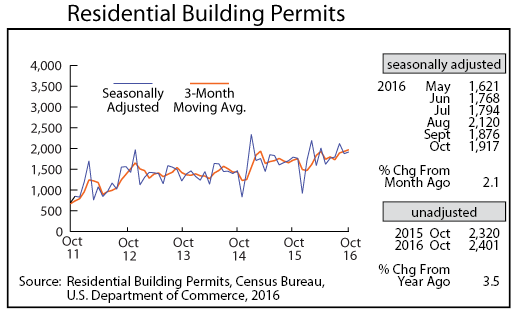
Adjusted Residential Building Permits zagged up slightly in October to 1,917. Home-building permit levels for the year are up 6.6 percent compared to the same period last year. Minnesota home-building activity will top last year’s level, but the increase in home construction will again be modest.
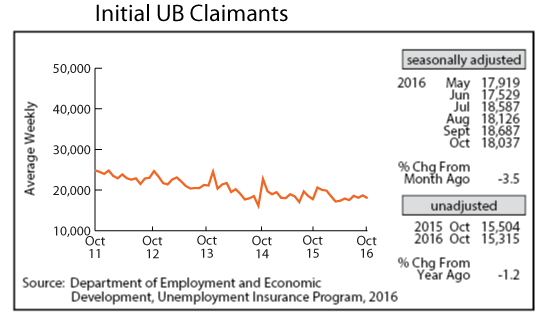
Adjusted Initial Claims for Unemployment Benefits (UB) zigzagged down in October to 18,037 as initial claims, a proxy for the layoff rate, continue to remain low by historical standards. Initial claims over the last four months have, however, run slightly higher than during the first six months of the year.
