by Chet Bodin and Cameron Macht
June 2015
The Northwest region displayed remarkable economic resiliency during and after the recession.
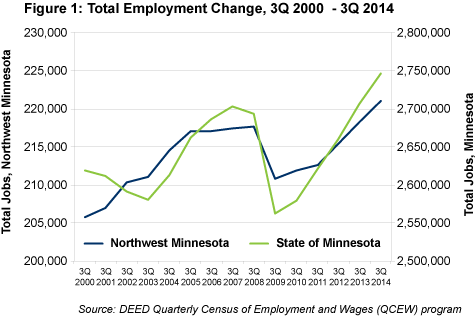
 Northwest Minnesota's economy proved to be more resilient during the recession than the rest of the state, suffering a much smaller employment decline from 2007 to 2009. Although employers in the 26-county planning region cut nearly 7,000 jobs during that two-year period, Northwest's 3.1 percent recessionary job decline was less severe than the 5.2 percent decrease statewide.
Northwest Minnesota grew from 205,738 jobs in the third quarter of 2000 to a pre-recessionary peak of 217,454 jobs in the third quarter of 2007. By the third quarter of 2009, jobs had fallen back to 210,769.
Like the state as a whole, Northwest Minnesota regained all the jobs it lost by the third quarter of 2013. The region added another 2,723 jobs in the past year, reaching 220,983 jobs at 16,604 business establishments in the third quarter of 2014.
Job growth was slower in the region than statewide during the recovery from 2009 to 2014, but Northwest Minnesota still has over 3,500 more jobs than before the recession and over 15,000 more jobs than in 2000. In fact, Northwest Minnesota added jobs faster than the state from 2000 to 2014 (see Figure 1).

Northwest Minnesota earned positive press coverage because it was home to seven of the nine counties in the state that had reached "full economic recovery," according to a report from the National Association of Counties.1
Clay, Marshall, Pennington, Polk, Pope, Stevens and Wilkin counties all met or exceeded pre-recession levels in the four economic recovery indicators examined in the report: annual change in jobs, unemployment rates, economic output (GDP) and median home prices. These measures indicate that Northwest Minnesota is at the forefront of the state's economic recovery.
Northwest Minnesota's economy has stayed strong because several sectors have displayed remarkable resiliency. Health care and social assistance, which is the largest industry in the region with 36,743 jobs, actually gained more jobs during the recession than in the recovery. The sector added more than 1,800 jobs from the third quarter of 2007 to the third quarter of 2014.
Despite losing more than 4,000 jobs during the recession, manufacturing is still the second-largest employing industry in the region with 28,967 jobs at 824 firms. The sector has regained almost 3,350 jobs since 2009. Manufacturers in Northwest Minnesota now have surpassed 97.6 percent of their 2007 employment level, compared with just 91.6 percent in Minnesota.
The region's large retail trade and leisure and hospitality industries still haven't fully recovered from the effects of consumers cutting back during the recession, although the accommodation and food services and the arts, entertainment and recreation sectors did add jobs in the past five years.
Educational services saw a boost in enrollment and employment coming out of the recession, as workers went back to school to train for new opportunities in the region. After adding 561 jobs from the third quarter of 2007 to the third quarter of 2014, educational services has 17,147 jobs at 364 institutions.
The largest employment gains were welcomed in the region's unique and strongly concentrated wholesale trade industry, which expanded during both the recession and recovery, adding nearly 2,200 net new jobs from third quarter 2007 to third quarter 2014. The region also saw a whopping 45 percent job growth in the administrative support and waste management services industry, which includes temporary staffing agencies.
In contrast, several other sectors have not fully recovered yet. Professional, scientific and technical services; information; construction; real estate; and finance and insurance were all still well below their prerecession employment levels (see Table 1).
| Northwest Minnesota Industry Employment Statistics, Q3 2007-Q3 2014 | ||||||
|---|---|---|---|---|---|---|
| NAICS Industry Title | Number of Firms Q3 2014 | Number of Jobs Q3 2014 | Quarterly Payroll Q3 2014 | Recession | Recovery | Total |
| Change in Jobs Q3 2007 - Q3 2009 | Change in Jobs Q3 2009 - Q3 2014 | Change in Jobs Q3 2007 - Q3 2014 | ||||
| Total, All Industries | 16,604 | 220,983 | $1,960,479,773 | -6,685 | +10,214 | +3,529 |
| Agriculture, Forestry, Fishing and Hunting | 716 | 5,092 | $42,340,229 | -19 | +977 | +958 |
| Mining | 43 | 325 | $4,693,300 | -65 | +92 | +27 |
| Construction | 2,178 | 12,651 | $154,279,702 | -1,352 | +916 | -436 |
| Manufacturing | 824 | 28,967 | $329,024,745 | -4,051 | +3,346 | -705 |
| Utilities | 65 | 1,322 | $25,709,191 | +19 | -112 | -93 |
| Wholesale Trade | 649 | 11,706 | $140,811,963 | +369 | +1,819 | +2,188 |
| Retail Trade | 2,414 | 28,232 | $170,172,129 | -759 | -178 | -937 |
| Transportation and Warehousing | 869 | 5,916 | $57,596,098 | -268 | +257 | -11 |
| Information | 238 | 2,988 | $30,468,564 | ND | ND | -768 |
| Finance and Insurance | 854 | 5,816 | $64,627,096 | +83 | -272 | -189 |
| Real Estate, Rental and Leasing | 429 | 1,511 | $10,274,507 | -285 | +13 | -272 |
| Professional, Scientific and Technical Services | 842 | 4,343 | $46,885,139 | -324 | -552 | -876 |
| Management of Companies | 58 | 853 | $17,022,091 | -16 | +200 | +184 |
| Administrative Support and Waste Management Services | 598 | 6,502 | $45,717,999 | -509 | +2,522 | +2,013 |
| Educational Services | 364 | 17,147 | $174,215,436 | -76 | +637 | +561 |
| Health Care and Social Assistance | 1,457 | 36,743 | $349,932,371 | +1,739 | +74 | +1,813 |
| Arts, Entertainment and Recreation | 367 | 5,544 | $25,075,370 | ND | +194 | ND |
| Accommodation and Food Services | 1,480 | 23,497 | $82,730,203 | ND | +672 | ND |
| Other Services | 1,456 | 6,455 | $32,994,174 | ND | +106 | ND |
| Public Administration | 703 | 15,368 | $155,909,466 | +708 | +146 | +854 |
| Source: DEED Quarterly Census of Employment and Wages (QCEW) program | ||||||
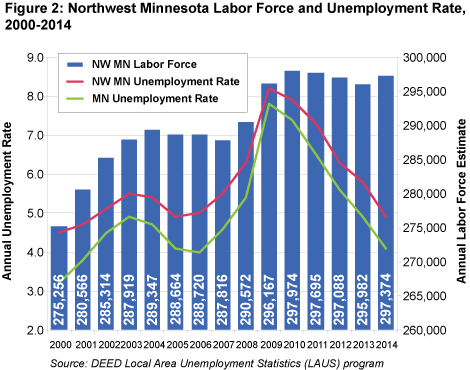
Northwest Minnesota's labor force has also demonstrated resiliency over time, with the number of workers rising rapidly from 2000 to 2010, then holding steady over the past five years. The region's labor force started with just over 275,000 workers in 2000 and peaked at almost 298,000 workers in 2010. The labor force averaged about 297,400 workers in 2014.
Unfortunately, the number of unemployed workers also rose over that period, from a low of 12,332 workers in 2000 to a high of 24,233 workers in 2009, before settling back down to 14,531 unemployed workers in 2014. Northwest Minnesota ended the year with a 4.9 percent unemployment rate, compared with 4.1 percent statewide. Regardless of economic conditions, Northwest Minnesota's unemployment rate has remained well above the state rate over time (see Figure 2).

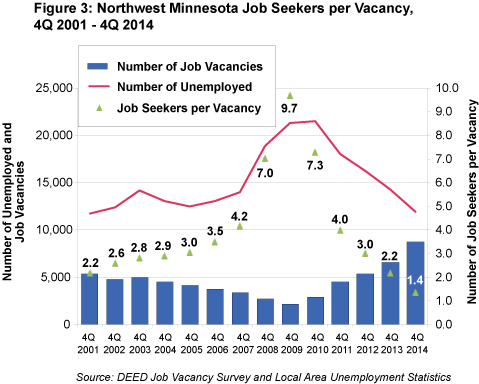
The large but shrinking number of unemployed workers has created a tightening labor market in the region, especially as businesses continue adding jobs. Employers in Northwest Minnesota posted the highest number of job vacancies ever reported in the fourth quarter of 2014, while the corresponding quarterly average of unemployed workers was the second lowest on record since 2001.
With an average of 11,881 unemployed workers and 8,703 job vacancies in the fourth quarter of 2014, Northwest Minnesota had just 1.4 job seekers per vacancy, which is the tightest the labor market has been in the region. The number of job seekers per vacancy climbed to as high as 9.7 in the depths of the recession in 2009 and then dropped by half every two years after that (see Figure 3).

Regional businesses will face increased competition to meet their workforce needs, so aligning the labor force to employer demands will be a key element of sustaining the economic progress in Northwest Minnesota. The region's high schools, technical and community colleges, universities, and tribal colleges will help train a large number of new potential workers for employers.