by Luke Greiner
November 2014
With winter just around the corner, most Minnesotans will be bracing themselves for the possibility of another 'polar vortex'. However, those employed in the retail industry prepare every year for a flurry of activity affectionately known as the holiday season. While some other industries take a long winter's nap, the retail trade industry ramps up employment to the highest levels of the year.
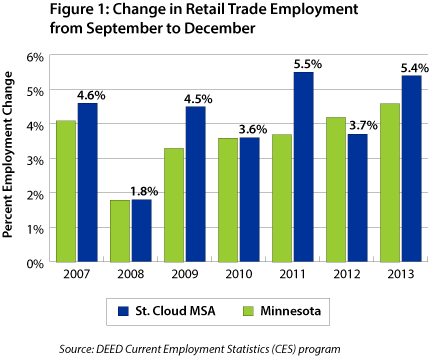
Using the Current Employment Statistics (CES), program data show that the retail industry's holiday season begins in Minnesota even before the snow flies. In fact, retail employment has experienced an increase in employment starting in October dating back to at least 1990. Last year saw a 4.6 percent increase from the September lull to December's peak and then a corresponding 4.1 percent decline from December to January 2014.
It is important to note that the retail trade industry also experiences a similar but less dramatic seasonal employment increase that typically begins in April and extends through August. Retail employment often surges in the summer before ebbing in the fall.
One of Minnesota's metropolitan areas, St. Cloud, serves as the regional hub of employment, shopping, and services for residents of Central Minnesota. With 12,975 jobs, the St. Cloud MSA has more than one-third of retail trade employment in the 13-county Central Minnesota region.
According to CES data, St. Cloud typically experiences a slightly larger increase in employment during the holiday season than the state (Figure 1). Retail employment gains in St. Cloud outpaced the state more than half the time from 2007 to 2013, regardless of the recession. What's more, in 2013 the St. Cloud MSA experienced increases in monthly employment from April to January without the typical lull that occurs after the summer employment hike.

According to IRS records, the retail trade industry provided Central Minnesota with $199 million in tax revenue from $8.4 billion in gross sales in 2012. Stearns and Wright counties both rank in the top 10 counties in the state for gross retail sales at 8th and 10th respectively.
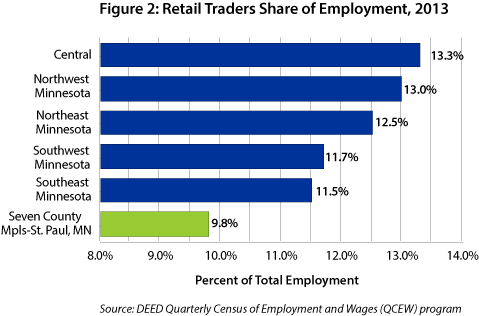
Retail trade is the third largest industry in Central Minnesota, with 2,341 establishments providing 34,467 jobs in 2013. Total payroll from the industry topped $802.5 million in 2013, about 8.4 percent of the total payroll for all industries. With 13.3 percent of all jobs, retail trade has a higher concentration of total employment in Central Minnesota than any other region (Figure 2).

With employment variations from Minnesota's seasons combined with holiday hiring, retail trade provides temporary and flexible employment opportunities. For students enrolled in high school or college, retail trade provides a great opportunity to work around academic schedules.
Just over 30 percent of jobs in the retail trade industry are held by workers under 25 years of age. These younger workers have a volatile employment cycle, specifically the 19- to 21-year-old age cohort. Interestingly, this cohort experiences two very significant escalations in employment through the course of the year, one in the first quarter and another in the third quarter, with corresponding declines in the second and fourth quarters.
Beginning-of-quarter employment counts can be deceiving, however, as the data are reflecting a change from the previous quarter. In these cases the job fluctuations are actually occurring for the summer in the second quarter and the holiday season in the fourth quarter.
While there is variation in seasonal jobs for other age groups in retail trade, the 19- to 21-year-old group is much more consistent. This suggests that younger workers provide the labor surge needed during the summer and, to a lesser extent, the winter, suggesting that school schedules are a large factor in younger workers' availability.
Retail trade establishments are found in some capacity in nearly every town in Central Minnesota. Motor vehicle and parts dealerships have the most establishments, while general merchandise stores furnish the most jobs. Table 1 provides the subsector breakdown of the retail trade industry as well as recent employment trends.
Unfortunately employment is still more than 1,000 jobs short of prerecession levels in retail trade, but five of the 12 retail subsectors have more jobs now than they had going into the recession in 2007. Non-store retailers stand out as both the fastest growing subsector since the start of the recession, gaining 292 jobs (35.9 percent) since 2007, and as the fastest growing subsector in the last year with an employment gain of 257 jobs (30.3 percent) from 2012 to 2013. Non-store retailers include electronic shopping and mail-order houses, vending machine operators, and direct selling establishments.
Positive repercussions from the growing health care industry can been seen in the health and personal care stores in Central Minnesota, with rapid increases in employment from 2012 to 2013 adding 204 jobs. While wages are relatively low in retail trade overall, average annual wages were 30 percent higher in health and personal care stores, amounting to an extra $7,072 over the course of the year (Table 1).
| Central Minnesota Retail Trade Employment Statistics | |||||
|---|---|---|---|---|---|
| Industry | 2013 Annual Data | 2007-2013 Employment Change | 2012-2013 Employment Change | ||
| Number of Firms | Number of Jobs | Average Annual Wage | |||
| Total, All Industries | 17,170 | 258,604 | $37,024 | -1,884 | 4,621 |
| Retail Trade | 2,341 | 34,467 | $23,244 | -1,035 | 546 |
| Motor Vehicle and Parts Dealers | 374 | 4,605 | $37,908 | -166 | 235 |
| Furniture and Home Furnishings Stores | 99 | 1,018 | $29,432 | -160 | 26 |
| Electronics and Appliance Stores | 71 | 586 | $30,160 | 41 | 0 |
| Building Material and Garden Equipment Stores | 223 | 3,393 | $28,392 | -264 | 142 |
| Food and Beverage Stores | 251 | 6,659 | $17,524 | -542 | -54 |
| Health and Personal Care Stores | 167 | 1,389 | $30,316 | 163 | 204 |
| Gasoline Stations | 319 | 3,632 | $15,444 | -17 | -59 |
| Clothing and Clothing Accessories Stores | 236 | 2,340 | $14,508 | 97 | -62 |
| Sporting Goods, Hobby, Book, and Music Stores | 120 | 1,269 | $17,628 | -119 | 35 |
| General Merchandise Stores | 129 | 6,988 | $20,280 | -395 | -308 |
| Miscellaneous Store Retailers | 227 | 1,480 | $24,544 | 36 | 129 |
| Nonstore Retailers | 126 | 1,106 | $31,408 | 292 | 257 |
| Source: DEED, Quarterly Census of Employment and Wages | |||||
Most recently, losses in retail trade have been primarily attributed to general merchandise stores, with 308 fewer jobs in the last year. Because non-store retailers compete for business with general merchandise stores, it is possible that some of the losses in general merchandise stores become gains in non-store retailers as noted above.
Beyond that, there has been a very clear shift away from department stores and toward warehouse clubs and superstores from 2012 to 2013. While department stores shed 2,125 jobs, warehouse clubs and superstores gained 1,814 jobs. Fortunately for workers in Central Minnesota, average wages are about 15 percent higher at warehouse clubs and superstores than in department stores at $21,996 versus $19,188 annually.
In addition to covered employment, there were also 5,642 self-employed retailers in Central Minnesota, providing nearly $190 million in sales receipts in 2012. Central Minnesota again has a higher concentration than the state, with 11.8 percent of all self-employed establishments as retail trade, compared to 9.7 percent in the state.
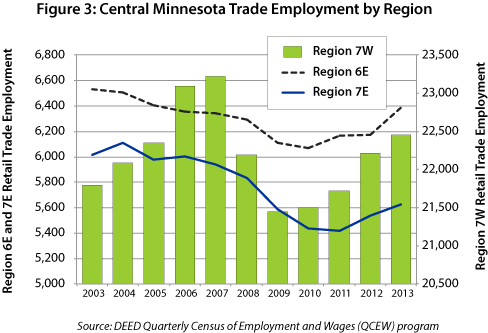
Regardless of the season, all three Economic Development Regions in Central Minnesota recently gained in retail trade employment. Region 6E expanded employment by the largest margin, 3.4 percent (210 jobs) from 2012 to 2013, while Region 7E grew 1.5 percent (87 jobs), and the regional hub, Region 7W, grew by 1.1 percent (248 jobs) (Figure 3).

Prior to the recession Region 6E experienced small but consistent declines in employment in retail trade as far back as 2003, while Region 7E also experienced declines prior to the recession but much more sporadically. On the other hand, Region 7W maintained positive growth until 2008, when it lost 4.4 percent of jobs in the retail trade industry.
Table 2 highlights the wages and employment of the most prevalent retail trade occupations in Central Minnesota. As the largest retail hub, wages are slightly higher in Region 7W than 6E and 7E for all occupations combined, but retail occupations have a larger degree of variation. First-line supervisors/managers of retail sales workers, the highest paying retail occupational group, earned a significant wage advantage by working in Region 7W.
Interestingly, the lower end of the wage distribution is very uniform across each region and occupation, with the more rural regions 6E and 7E often paying more than Region 7W to start. The 10th percentile wage reflects an entry level or very low skilled wage, while the 90th percentile reflects a very experienced or advanced skill level. In contrast, aside from counter and rental clerks in region 6E, the 90th percentile annual wage demonstrates a clear advantage for retail workers in the St. Cloud MSA and Region 7W. In many cases workers in the 90th percentile make $10,000 or more per year in 7W than in the other regions of Central Minnesota (Table 2).
| Employment Statistics for Common Retail Trade Occupations, 2nd Quarter 2014 | |||||
|---|---|---|---|---|---|
| SOC code | Occupational Title | Employment | Annual Median Wage | 10th Percentile Annual Wage | 90th Percentile Annual Wage |
| 0 | Total, All Occupations | 48,270 | $33,038 | $18,382 | $68,920 |
| 411011 | First-Line Supervisors/Managers of Retail Sales Workers | 530 | $32,954 | $24,515 | $46,043 |
| 412011 | Cashiers | 1,500 | $18,364 | $16,112 | $22,868 |
| 412021 | Counter and Rental Clerks | 100 | $18,515 | $16,159 | $38,498 |
| 412022 | Parts Salespersons | 200 | $29,717 | $21,639 | $43,806 |
| 412031 | Retail Salespersons | 1,330 | $19,933 | $16,471 | $31,589 |
| 0 | Total, All Occupations | 45,990 | $33,011 | $18,240 | $66,918 |
| 411011 | First-Line Supervisors/Managers of Retail Sales Workers | 450 | $30,740 | $21,863 | $46,353 |
| 412011 | Cashiers | 1,790 | $18,720 | $16,275 | $24,179 |
| 412021 | Counter and Rental Clerks | 110 | $18,779 | $16,276 | $24,085 |
| 412022 | Parts Salespersons | 130 | $22,928 | $17,562 | $37,546 |
| 412031 | Retail Salespersons | 1,370 | $22,676 | $17,131 | $34,466 |
| 0 | Total, All Occupations | 168,450 | $34,334 | $18,237 | $73,966 |
| 411011 | First-Line Supervisors/Managers of Retail Sales Workers | 1,730 | $37,774 | $24,542 | $57,182 |
| 412011 | Cashiers | 5,010 | $18,601 | $16,178 | $24,771 |
| 412021 | Counter and Rental Clerks | 400 | $19,105 | $16,406 | $30,113 |
| 412022 | Parts Salespersons | 440 | $33,423 | $19,316 | $47,719 |
| 412031 | Retail Salespersons | 7,040 | $20,273 | $16,429 | $37,333 |
| Source: DEED Occupational Employment Statistics | |||||
Central Minnesota's retail trade industry is expected to grow slightly slower than the total of all industries over the next decade, perhaps adding about 4,500 jobs. However, the retail trade industry experiences employment swings multiple times each year and still manages to meet the demand of local consumers. Like holiday sales, retail hiring also winds up and then winds down into hibernation until the next seasonal surge.