by Mohamed Mourssi-Alfash
October 2014
This article on disability employment in Minnesota, the final in a series, is based on 2012 American Community Survey (ACS) data. The ACS replaced the Decennial Census long form in 2005. The report will discuss four major characteristics of disability employment in Minnesota in 2012: Disability prevalence, employment rate, full-time/full-year employment, and poverty.
At the national level Executive Order 13548 directs the federal government, as the largest employer in the nation, to become a role model for the employment of individuals with disabilities. This is in support of Executive Order 13163, which directs the federal government to adopt a goal of hiring 100,000 individuals with disabilities within five years. In March 2014 the U.S. Department of Labor announced changes in regulations for implementing Section 503 of the Rehabilitation Act. Section 503 now includes a rule to ensure that contractors doing business with the federal government reserve 7 percent of their jobs for people with disabilities.
At the state level Executive Order 14-14 directs all state agencies to increase employment of people with disabilities to at least 7 percent by August 2018. This directive was driven by reports showing that, although Minnesota maintains one of the highest rates of disability employment in the nation, the number of state employees with disabilities had declined since 1999. The executive order followed the Reform 2020 budget package which invests about $400,000 in a two-year plan (2012-2014) to support 18-to 26-year-old Minnesotans with disabilities in having access to employment.
According to the American Community Survey (ACS) definitions, disability status covers six major categories: Ambulatory Disability, Cognitive Disability, Hearing Disability, Independent Living Disability, Self-Care Disability, and Visual Disability.
Table 1 shows that in 2012 about 10.3 percent of the entire non-institutionalized population in Minnesota reported a disability, increasing from 9.9 percent in 2011, while the national prevalence rate remained the same as it was in 2011 at 12.1 percent. The 5,322,800 population of non-institutionalized people living in Minnesota included 548,248 people with disabilities, about one in 10. Their prevalence in the working-age group, ages 21-64, increased to 8.5 percent in Minnesota and 10.4 percent at the national level. Thus, the 2012 disability prevalence rate in Minnesota increased by 0.6 percent from 2011 while the national rate decreased by about 0.1 percent.
| Disability Prevalence | |||
|---|---|---|---|
| Area | 2011 Percent
with Disabilities |
2012 Percent
with Disabilities |
Percent
Change |
| U.S. | 12.1% | 12.1% | 0.0% |
| Minnesota | 9.9% | 10.3% | 0.4% |
| Disability Prevalence in Working Age Cohort | |||
| Area | 2011 Percent with Disabilities | 2012 Percent with Disabilities | Percent Change |
| U.S. | 10.5% | 10.4% | -0.1% |
| Minnesota | 7.9% | 8.5% | 0.6% |
| Source: ACS Data | |||
As shown in Table 2, the 2012 ACS data indicate that the share of working-age people with disabilities participating in the workforce in the U.S. increased slightly from 33.4 percent in 2011 to 33.5 percent in 2012. Of the 18,890,100 total, non-institutionalized, working age people with disabilities in the United States, 6,328,000 were employed. Minnesota employment for the total number of people with disabilities showed a significant decrease of 5 percent from 2011 to 2012 and 42.7 percent from 47.7 percent, while employment for the total number of Minnesotans without disabilities increased from 81.8 percent in 2011 to 83.4 in 2012. The 5 percent decline of employment among people with disabilities may point to a 'last-in/first-out' protocol. Another disappointing indicator from the 2012 data is that Minnesota fell from second to fifth place in the rate of disability employment among states.
| Percent of Total Population Employed | |||
|---|---|---|---|
| Area | 2011 | 2012 | Percent Change |
| U.S. | 71.2% | 71.8% | 0.6% |
| Minnesota | 79.1% | 79.9% | 0.8% |
| Percent of Population with Disabilities Employed | |||
| Area | 2011 Percent | 2012 Percent | Percent Change |
| U.S. | 33.4% | 33.5% | 0.1% |
| Minnesota | 47.7% | 42.7% | -5.0% |
| Source: ACS Data | |||
The ACS defines full-time status as working 35 or more hours per week and full-year status as working 50 or more weeks in a 12-month period.
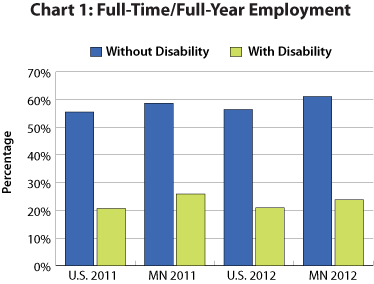
Chart 1 illustrates how employed people with disabilities continued to be less likely to maintain a full-time/full-year status than those with no disability in 2012. Although there was a 0.2 percent improvement in 2012, only 20.9 percent of working-age people with disabilities in the U.S. claimed a full-time/full-year employment status compared to 56.4 percent of workers without disabilities, an increase from 55.5 percent in 2011. In Minnesota the percent of full-time/full-year employment status among working-age people with disabilities decreased to 23.8 percent from 25.9 percent during the same time period. The full-time/full-year rate among Minnesotans in the working-age group without disabilities increased by 2.4 percent in 2012, rising from 58.7 percent in 2011 to 61.1 percent in 2012.

According to the Institute for Research on Poverty at the University of Wisconsin at Madison, the official U.S. poverty measure is based on the federal poverty thresholds created in 1982 and adjusted annually to be aligned with cost-of-living increases. The poverty level is calculated based on the cost of minimum food consumption with the assumption that families spend a third of their income on food. These poverty thresholds consider the size of the family and are indexed to 2008 dollars using poverty factors based on the Consumer Price Index. The poverty level in this article specifies the percentage of people with disabilities in the working-age group in the U.S. and in Minnesota who were living below the poverty line in 2012.
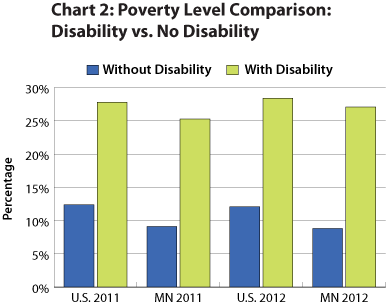
Particularly relevant to the low rates of employment and full-time/full-year status is the poverty level among people with disabilities. Chart 2 shows that in 2012 an estimated 28.4 percent of the 18,823,698 people in the working-age group with a disability in the U.S. were living below the poverty line compared to 27.8 percent in 2011. This is more than twice the rate of poverty among those of working age without disabilities, 12.1 in 2012, down about 0.4 percent from 2011. In Minnesota 27.1 percent of working-age people with disabilities were living under the poverty level in 2012, an increase of 1.8 percent from 2011 and more than three times the rate of the same age group without disabilities. Such an indicator should be considered a warning since the overall poverty rate for Minnesotans with disabilities has increased over time compared to those without disabilities whose poverty level decreased from 9.1 percent in 2011 to 8.8 percent in 2012.

People with disabilities are still under-employed in Minnesota and nationwide. Even the advances made in recent years have proved to be insufficient to meet the needs of people with disabilities who are participating in the workforce, both those who are employed and those searching for employment. People with disabilities in Minnesota and in the nation benefit from measures taken to enhance their employment opportunities in government agencies, but they still suffer from underemployment economy-wide. There is more to be accomplished to offer those with disabilities the lives they deserve.