by Nick Dobbins
June 2016
Monthly analysis is based on unadjusted employment data.
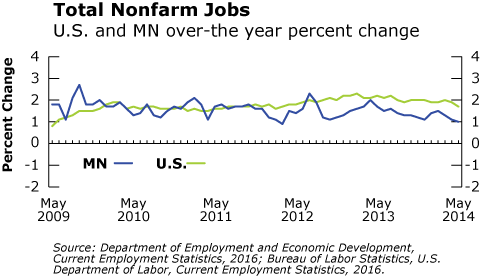
Employment in the Minneapolis-St. Paul MSA increased by 23,721 jobs (1.2 percent) in May. While the monthly growth is notable, changes of this size are fairly common for the month, as most of the seasonal expansion of employment tends to occur in April and May. In fact, the 1.2 percent growth rate on the month matches the employment change that occurred between April and May of 2015. As expected, the growth this year was driven by two highly seasonal supersectors, Leisure and Hospitality (up 7,546 jobs or 4.2 percent) and Mining, Logging, and Construction (up 5,762 or 7.8 percent). Professional and Business Services also showed notable growth for the month, adding 4,207 jobs (1.4 percent), thanks to the addition of 4,945 jobs (4.7 percent) in Administrative and Support and Waste Management and Remediation Services. Annually, employment in the metro area was up by 28,352 jobs or 1.5 percent. Unlike the over-the-month gain, this growth was spread across nearly every supersector. The only group to lose jobs on the year was the long-suffering Information supersector, which was off by 142 jobs or 0.4 percent. Educational and Health Services remained the biggest annual growth supersector, adding 10,419 jobs (3.3 percent), with both component sectors contributing to the expansion. Professional and Business Services remained strong on the year as well (up 4,325 or 1.4 percent) although Employment Services, a component industry group which some consider a bellwether for the market, was down by 3,095 jobs (6.1 percent) on the year.
The Duluth-Superior MSA added 1,944 jobs (1.5 percent) in May. As would be expected in the spring, the gains were led by an increase of 1,133 jobs (8.7 percent) in Leisure and Hospitality and 560 jobs (7 percent) in Mining, Logging, and Construction. Government employers saw the sharpest declines in May, shedding 203 jobs (0.8 percent) from a loss of 362 jobs (4.7 percent) in State Government employment. Over the year, Duluth lost 1,740 jobs (1.3 percent) and is one of only two MSAs in the state to have lost jobs on the year, the other being Grand Forks – East Grand Forks. The loss was driven almost entirely by goods producers, as Manufacturing lost 713 jobs (9.5 percent) and Mining, Logging, and Construction lost 693 (7.5 percent). Professional and Business Services, Government, and Leisure and Hospitality also lost jobs on the year. Educational and Health Services had the largest numerical gains in the region, adding 426 jobs (1.4 percent), although this was well behind the annual statewide growth in the supersector. The largest proportional annual growth came in the Information supersector, which added 37 jobs, a 2.6 percent change.
Employment in the Rochester MSA was up by 1,025 jobs (0.9 percent) in May. The gains were widespread but largely driven by seasonal growth in Mining, Logging, and Construction (up 417, 9.8 percent) and Leisure and Hospitality (367 jobs, 3.8 percent). Trade, Transportation, and Utilities also had a strong month, adding 235 jobs (1.3 percent) on the back of Retail Trade, which added 232 jobs or 1.9 percent. The steepest drop in both proportional and absolute terms was in the Manufacturing supersector, which lost 151 jobs or 1.4 percent. Annually, Rochester added 1,733 jobs (1.5 percent). By itself, Educational and Health Services added 1,902 jobs (4.2 percent), the most growth of any supersector in a region known for its health services industry. At the other end of the spectrum, Leisure and Hospitality had the most lost jobs on the year, with employment off by 494 (4.7 percent).
The St. Cloud MSA grew by 704 jobs (0.6 percent) in May. The only supersectors to lose employment on the month were Manufacturing (down 279 or 1.9 percent), Professional and Business Services (down 38 or 0.4 percent), and Government (down 285, 1.8 percent). The most actual and proportional growth came in Mining, Logging, and Construction, which added 655 jobs or 10.3 percent. Over the year the area added 1,983 jobs (1.8 percent). Mining, Logging, and Construction was up by 645 jobs (10.1 percent), which was the largest proportional gain for a supersector, and Educational and Health Services added 1,229 jobs (5.8 percent), the largest numerical gain. The steepest drop came in Leisure and Hospitality, which lost 472 jobs or 5.3 percent.
Employment in the Mankato-North Mankato MSA was down in May as the area shed 193 jobs (0.3 percent) from April estimates. Service Providing industries lost 243 jobs (0.5 percent) while Goods Producers added just 50 (0.5 percent). Private Sector employment dipped by 78 (0.2 percent) in the area, and Government employers shed 115 jobs (1.2 percent). Annually, the MSA added 662 jobs (1.2 percent). Although Goods Producers lost 362 jobs (3.6 percent) and Government employers lost 19 (0.2 percent), Private Service Providers added 1,043 jobs (2.9 percent) which more than covered the losses.
Employment in the Fargo-Moorhead MSA was up by 1,141 jobs (0.8 percent) in May. Mining, Logging, and Construction added 1,008 jobs (11.2 percent), and Leisure and Hospitality added 533 (3.8 percent). Professional and Business Services was the big loser on the month, shedding 380 jobs (2.3 percent). Annually, the Fargo-Moorhead area added 1,850 jobs (1.3 percent). Educational and Health Services was the big mover, as the supersector added 818 jobs or 3.7 percent.
Employment in the Grand Forks-East Grand Forks MSA was up by 573 (1 percent) in May. Mining, Logging, and Construction added 451 jobs (14.4 percent). However, the other usual seasonal grower, Leisure and Hospitality, actually shrank on the month, losing 14 jobs (0.2 percent). Annually, the area lost 146 jobs (0.3 percent), making it one of only two MSAs to see negative over-the-year growth. Notable losses came in Government employment (down 214 or 1.5 percent) and Leisure and Hospitality (down 193, 3.1 percent).
