by Alessia Leibert
March 2014
How successful are students at finding quality jobs and stable employment after graduation? Minnesota is part of a new initiative that is helping to answer those questions.
With rising tuition costs, it is more important than ever to think through post-secondary education choices, such as which school to attend and what field of study to pursue. Unfortunately, outside of population statistics and anecdotes, not much information is available about the job outcomes for graduates. How quickly do they find work? Do they remain in Minnesota? How much do jobs pay after graduation and how stable is employment in their fields of study?
To get a better understanding of those questions, this article looks at data from the Workforce Data Quality Initiative (WDQI), which combines education and workforce statistics into a comprehensive system for research and analysis. Among the goals of the initiative is to follow students through school into the workforce and to provide statistics on their employment outcomes. Minnesota is among 29 states participating in the initiative, which is funded by the U.S. Department of Labor. While historical results cannot predict future outcomes for students, they can help set realistic expectations about employability and wages after graduation.
About the Workforce Data Quality InitiativeThis work is being funded by a grant that DEED received from the U.S. Department of Labor's Employment and Training Administration. |
When choosing where to go for college or other post-secondary study, students should take into account not only personal interests and aptitudes, but also labor market outcomes for recent graduates.
What criteria should be used to compare programs? Wages after graduation certainly are important but provide only part of the picture. Other factors also should be considered, including the following:
Employability: How many students found jobs in the state after completing a post-secondary training program?
Wages: What hourly pay can a graduate expect 12 months after graduation?
Wage growth trends: While wages can be volatile the first year after graduation, the trend gives a better picture of long-term earning potential.
Year-round employment: What share of graduates was employed without interruption during the second year after graduation? Programs that produce many workers in sectors with high seasonal unemployment, such as manufacturing and construction, have low year-round employment shares. Continuous work histories, not necessarily with the same employer, tend to translate into higher long-term earnings.
Full-time employment: What share of graduates was employed full time during the entire second year after graduation?
Table 1 offers a snapshot of employment outcomes for 2011 graduates broken down by degree level.
| Employment and Wage Outcomes of 2011 Program Completers by Award Level | ||||||
|---|---|---|---|---|---|---|
| Total Graduates With Valid SSNs* | Percent Employed** 12 Months After Graduation | Median Hourly Wage 12 Months After Graduation | Increase in Median Hourly Wage From 12 to 24 Months | Second Year Full-Time Employment*** | Second Year Full-Time Median Wage | |
| All Awards | 74,238 | 67% | $ 16.49 | + $1.87 | 42% | $41,475 |
| Awards of Less Than 2 Years | 9,674 | 72% | $ 14.02 | + $1.38 | 33% | $33,988 |
| Awards From 2 to Less Than 4 Years | 21,923 | 63% | $14.62 | + $1.38 | 43% | $36,887 |
| Bachelor's | 29,274 | 63% | $16.14 | + $2.34 | 40% | $40,222 |
| Graduate | 12,399 | 62% | $30.13 | + $2.26 | 56% | $64,352 |
|
* Graduates without a valid Social Security number cannot be matched to wage records. Graduates who earned more than one degree in the same academic year were classified according to the highest degree obtained. **Employed in Minnesota by employers who pay Minnesota unemployment insurance. *** Percent of graduates who worked each quarter of the year for at least 1,820 hours, representing an average of 35 hours a week for a full year. |
||||||
|
Sources: Minnesota unemployment insurance wage records and Minnesota Office of Higher Education post-secondary graduation records. Data on each individual completing a degree from July 2010 through June 2012 were linked with wage records from all employers subject to unemployment insurance taxes in Minnesota. |
||||||
Results show that 67 percent of graduates found jobs in Minnesota 12 months after completing their degrees. This figure underestimates actual employment because of a few data gaps. Although about 95 percent of Minnesota businesses report wages, graduates employed at federal agencies, self-employed or employed in other states are not found in payroll records. For example, graduate-level programs have fewer matches because their graduates are more likely to seek employment nationally, and programs in fields where self-employment is prevalent — such as construction or agriculture — tend to have fewer matches as well.
Table 1 also shows that wages 12 months after graduation vary by degree level, with graduate-degree holders boasting the highest median rates ($30 an hour) and sub-baccalaureate award holders the lowest rates. As expected, hourly wages increased over time at every degree level.
These data have interesting policy implications. For example, less than one-half of graduates with verifiable employment records had full-time jobs during the second year after graduation. The share of full-time employment ranges from 33 percent for sub-baccalaureate degree holders to 56 percent for graduate-degree holders.1 This means that, even when graduates find jobs, employment is predominantly part time, temporary or seasonal. Only a minority of recent graduates landed jobs that provide a living wage, health care benefits and an opportunity to save for retirement.
Choice of degree and major is mostly driven by personal interests, aptitudes and career goals — and for good reasons. Some majors fire the imagination more than others. Who has not heard someone say they want to become a veterinarian, marine biologist, journalist or soccer trainer? And when demand for such careers shows growth or stability, it does make sense to pursue personal interests.
Market demand can change so rapidly that popular programs can become saturated over the two or four years it takes to complete a degree. Timely, updated program outcomes can help individuals, counselors, education planners and policymakers identify training fields at risk of becoming saturated.
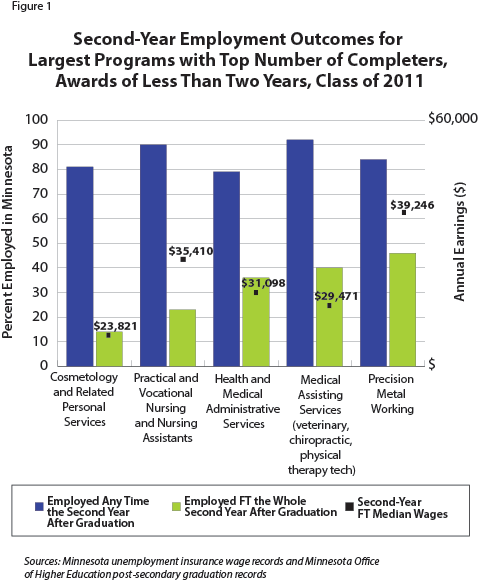
A few examples demonstrate how the data can help identify strengths and weaknesses in training programs. Figure 1 shows the top sub-baccalaureate programs by number of graduates in the 2011 academic year.

These short-term programs, mostly certificates, have a high employment rate because they prepare people for work in specific occupations.2 They are strategically important for Minnesota's economy and represent a good alternative to two- or four-year college degrees. They differ in some important respects, however.
Cosmetology graduates are predominately employed part time, and the 14 percent working full time earned an annual wage of only $23,821 a year after graduation. On the other hand, graduates in precision metal working were more likely to work full time and had considerably higher full-time earnings at $39,246. These programs prepare people for high-demand careers such as welding and machining, primarily in advanced manufacturing where wages tend to be higher than service industries.
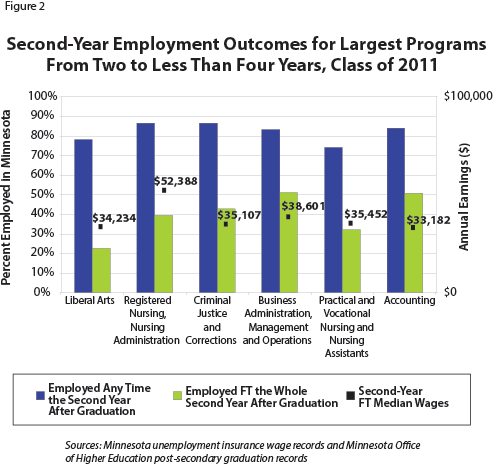
Outcomes for the most popular associate degree programs are displayed in Figure 2.

Liberal arts represents an interesting case. Although only 23 percent of graduates worked full time the second year after graduation, their wages were close to the state median of $37,606, suggesting that people with general skills are well rewarded when they find full-time employment, although it might take them longer to get a job. Full-time employment in occupational/technical fields is higher than liberal arts, although rarely rising above 50 percent. As expected, the best outcomes in terms of both employability and earnings are in registered nursing programs, thanks to growth in the health care industry.
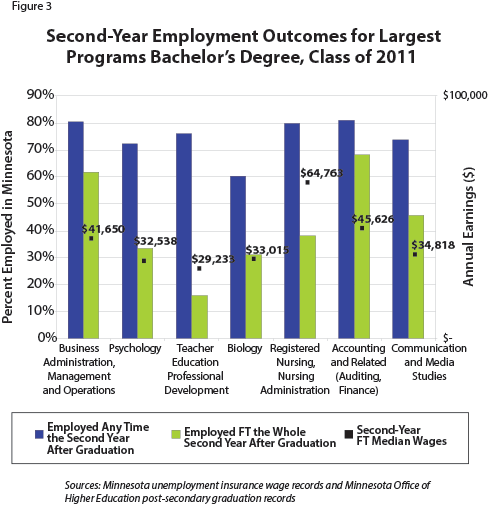
Bachelor's degree graduates are more likely to work full time for the whole year, as illustrated in Figure 3.

Biology, despite being in a science field, appears to be saturated, with a mediocre employment rate of 60 percent and predominately part-time employment. In general, employment in a science field might require an advanced degree.
Again, registered nursing boasts some of the strongest outcomes, with a second-year employment rate of 80 percent and second-year full-time earnings of $64,763. Accounting and related services is worth noticing as the program with the strongest share of full-time year-round employment (68 percent), indicating an abundance of job opportunities for graduates. When a program prepares a high number of students for so many quality jobs close to the time of graduation, we can assume that the job market for these skills is strong and growing.
There is a strong relationship between major and employment outcomes. In fact, the analysis shows that the same fields of study fared well at all three degree levels: nursing, business administration and accounting. By and large, successful outcomes are driven by high-demand career concentrations within these broad fields, such as registered nursing and financial management, and by growth in the industries that employ these graduates.
Also, some programs, such as teacher education and criminal justice and corrections, are tailored to public sector employment, while others such as business administration are mostly tailored to the private sector. These fundamental differences must be taken into account when drawing comparisons. While straight wages are higher in the private sector, the public sector has other types of advantages not captured in the data, such as strong benefits packages.
That's why the data are most effective when used in combination with other sources of information, including those that examine differences in curriculum, typical careers that result from each program and employers that hire recent graduates. Furthermore, school characteristics also matter. People who complete degrees at certain colleges tend to have higher earnings than others.
Lastly, caution is recommended when trying to use these data to draw conclusions about program performance for school accountability purposes. Straight comparisons of outcomes from one program to another do not tell the whole story because many factors affect job market outcomes. Some of the main driving factors of success include the following:
1Some sub-baccalaureate degree holders in transfer programs might decide to re-enroll in school rather than search for employment right away.
2Wage data do not provide any information on the occupation of employment.