by Dave Senf
June 2020
Note: All data except for Minnesota’s PMI have been seasonally adjusted. See the feature article in the Minnesota Employment Review, May 2010, for more information on the Minnesota Index.
The Philadelphia Federal Reserve Bank, which produces the Minnesota Leading Index, has temporarily suspended generation of state leading indices.
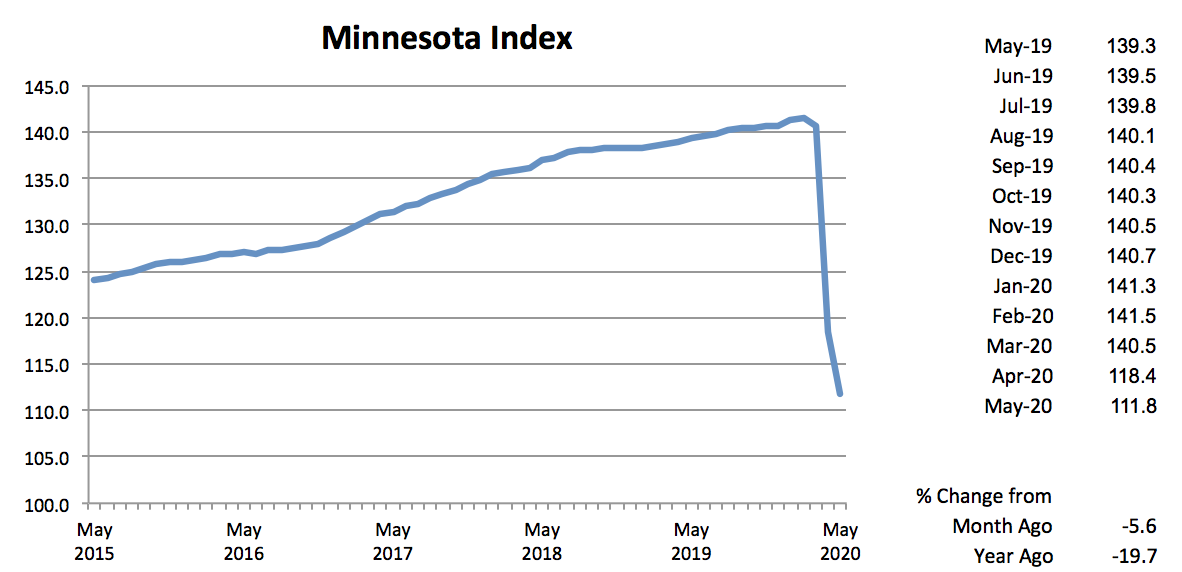
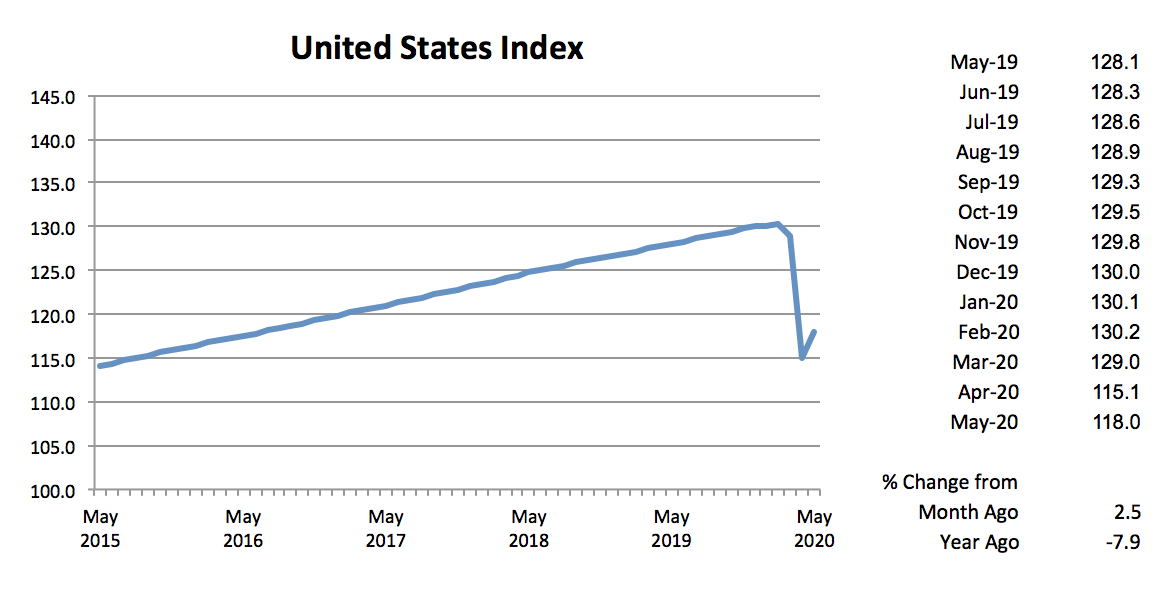
After nosediving during the previous three months, the Minnesota Index advanced 3.2 percent to 117.6 in June. The U.S. index increased 2.7 percent in June. All four components of the index improved as wage and salary employment skyrocketed, unemployment dipped, wage and salary disbursements rose, and average weekly manufacturing hours inched up. The state’s unemployment rate tailed off from a record of 9.9 percent to a still depressing 8.6 percent. There have been only seven months over the 534 months, dating back to 1976, of consistent unemployment estimates for the state in which the unemployment rate has been higher than 8.6 percent.


Adjusted Wage and Salary Employment skyrocketed by a record high 84,700 jobs in June as the state’s economy continued to reopen with COVID-19 restrictions gradually being reduced. In percentage terms, jobs in Minnesota increased 3.2 percent while rising nationally 3.6 percent in June. Jobs added in May were significantly revised upwards for Minnesota, bringing employment expansion over the last two months to roughly 111,000. The jobs added over the last two months account for roughly 29 percent of the 388,000 jobs lost in March and April. Minnesota lost 13.0 percent of its wage and salary employment during the March and April period compared to 14.5 percent for the U.S. The U.S. has recovered 34 percent of the jobs lost as of June compared to Minnesota’s 29 percent.
Almost all of June’s job expansion was in the private sector as private payrolls expanded by 84,400, and public sector payrolls increased by 300. Payrolls expanded the most in sectors that were hit the hardest by the coronavirus shutdown. Leisure and Hospitality, Trade, Transportation, and Utilities, Educational and Health Service, and Other Services added a combined 82,600 jobs. Three sectors cut their workforce with Financial Activities and Construction cutting the most jobs.
Minnesota’s unadjusted over-the-year employment decline was 9.1 percent in June, slightly higher than the 8.7 percent decline recorded by the U.S. Utah and Idaho had the lowest over-the-year decline in June with 2.8 percent, while the steepest declines were in Hawaii and New York, where jobs have dropped by more than 15 percent from a year ago. Minnesota’s 9.1 percent decline ranks 23rd steepest among the states, just a tad smaller than Maryland and slightly higher than Kentucky. June’s over-the-year percent declines for surrounding states were South Dakota (5.4), Iowa (7.5), North Dakota (8.9) and Wisconsin (10.0).
Online Help-Wanted Ads declined for a third consecutive month, dropping 14.2 percent to 91,400. June’s level is roughly 34 percent below postings in March. U.S. online job postings also declined in June, dipping 11.4 percent. Nationwide online postings are down 36 percent from their March level.
Minnesota’s Purchasing Managers’ Index (PMI) rose for the second month in a row after plunging in April. June’s 45.0 reading still suggest manufacturing activity in the state is contracting but at a slower pace than in over the last few months. The Mid-America Business Index increased to 50.3, and the national PMI rose to 52.6, suggesting that Minnesota’s manufacturing activity is recovering slower than manufacturing in other parts of the county.
Average weekly Manufacturing Hours inched up for the second straight month, but June’s low average weekly hours of 37.4 remains well short of the average pre-pandemic workweek. Average weekly Manufacturing Earnings slipped for the seventh of the last eight months, dipping to $887.97. June’s inflation-adjusted manufacturing earnings for production workers were down 7.8 percent from the 50-year series high set in October 2019.
Adjusted Residential Building Permits zigzagged up in June to 2,501, the highest monthly total since January. Through the first half of the year home-building permits were only 5.5 percent below the same period last year. Home building activity in Minnesota as well as nationally has been surprisingly strong given the high rate of unemployment. Record low mortgage rates are boosting demand for new home construction.
Adjusted Initial Claims for Unemployment Benefits (UB) continued to retreat in June, sinking to 124,425. That is less than one-third of April’s total but still well above normal levels. Initial claims for all of 2019 totaled just under 200,000 or roughly 16,515 per month. June’s high level, while an improvement over the last two months, indicates that workers are still being laid off at a high rate even as job growth accelerates.