by Dave Senf
January 2019
Note: All data except for Minnesota’s PMI have been seasonally adjusted. See the feature article in the Minnesota Employment Review, May 2010, for more information on the Minnesota Index.
The Minnesota Leading Index and Residential Building Permits level for December were not available at publication date owing to the federal government shutdown
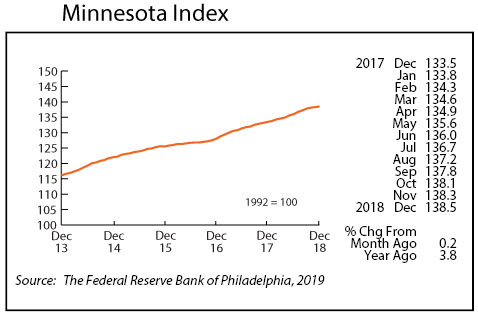
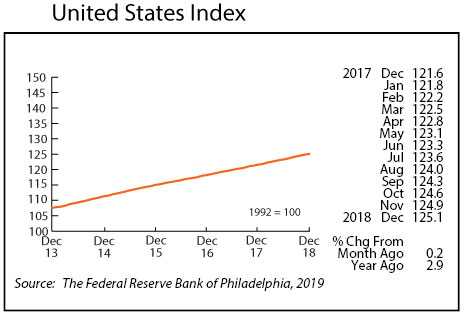
The Minnesota Index advanced for the 28th straight month in December, climbing 0.2 percent. The pace of economic growth inched up in December but remained sustainably slower than during the middle of the year when the index was advancing on average by 0.4 percent monthly. A small change in wage and salary employment and unchanged unemployment rate restricted growth in the index despite a small uptick in average weekly manufacturing hours.
Minnesota’s index, on an annual average basis, increased 3.7 percent in 2018 compared to the 2.9 increase for the U.S. index. Last year was the second year in a row that Minnesota’s index increased 3.7 percent on an annual average basis. The index advanced 4.7 percent in 2014, 4.0 percent in 2015, 2.1 percent in 2016, and 3.7 percent in 2017.
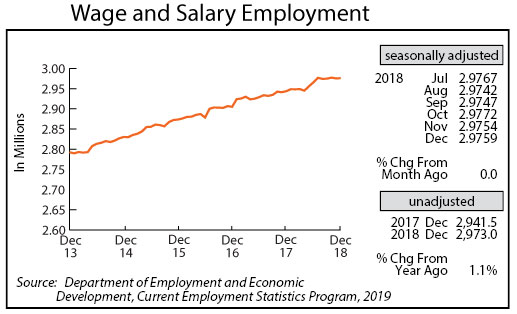
Minnesota’s adjusted Wage and Salary Employment zigzagged upwards slightly in December with 500 jobs added. Job growth in the state has been minimal over the last few months after spiking from May to July. Over-the-year job growth, using seasonally adjusted numbers, was 32,200 between December 2017 and December 2018.
While the goods-producing sector added 1,700 jobs in December, 1,200 jobs were cut in the service-producing sector. Job expansion was the highest in Leisure and Hospitality and in Construction. Professional and Business Services, and Educational and Health Services cut the most positions.
Minnesota’s unadjusted over-the-year job growth held steady at 1.1 percent in December. The annual average job growth rate was 1.2 percent for 2018 down slightly from 1.3 percent in 2017. The 1.2 percent annual average increase translates into a 33,650 job increase in Minnesota in 2018 compared to 38,190 in 2017 when job growth was 1.3 percent. Annual average job growth nationally in 2018 was 1.6 percent for the second year in a row.
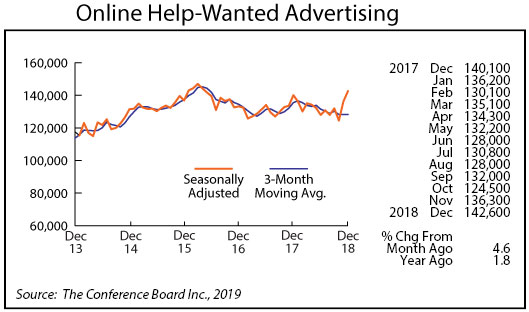
Online Help-Wanted Ads spiked again in December to 142,600, the highest level since April 2016. Minnesota’s job postings were 4.6 percent in December while U.S. job postings climbed 5.0percent. Minnesota’s share of nationwide online help-wanted ads stayed at 2.7 percent in December. That is the lowest level since May 2017 but still sustainably above the state’s 2.0 percent share of nationwide wage and salary employment.
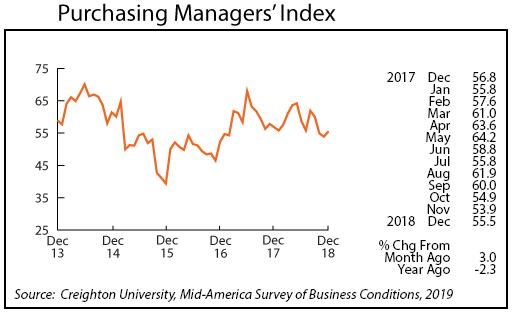
Minnesota’s Purchasing Managers’ Index (PMI), after slumping for the previous three months, increased in December to 55.5. The comparable national index tailed off to 54.1 in December while the Mid-America Economic Index advanced to 55.2. The 54.1 national reading was the lowest since November 2016. The indices are derived from a survey of manufacturing supply executives based on information they have collected within their respective organizations. A reading above 50 (below 50) suggest growth (contraction) over the next three to six months. The Minnesota index is pointed towards continued expansion of manufacturing activity in the state through the first half of 2019.
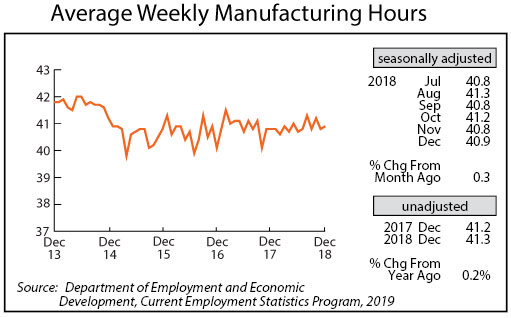
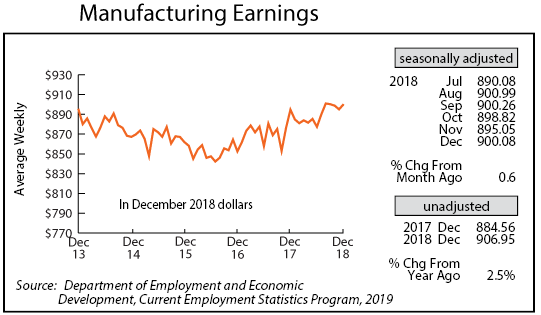
Adjusted average weekly Manufacturing Hours inched up in December to 40.9 hours from a revised 40.8 in November. The annual average factory workweek for 2018 ended up at 40.9 hours, unchanged from 2017. The 49-year average is 40.5 hours, so 40.9 for 2018 is slightly above average. The highest annual average factory workweek recorded was 41.7 hours in 2014. Average weekly Manufacturing Earnings adjusted for inflation and seasonality rose for the first time in four months in December, climbing to $900.08. Annual real average weekly manufacturing hours increased 2.0 percent in 2018, from $872.42 in 2017 to $889.99 in 2018. The 2.0 percent inflation adjusted increase last year was down slightly from the 2.4 increase in 2017.
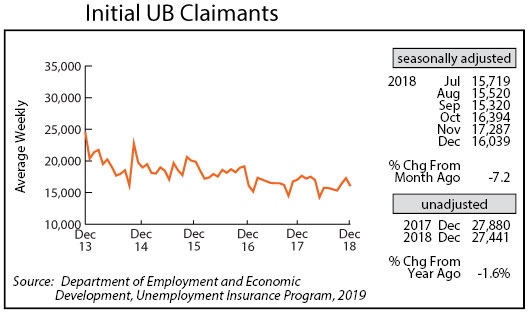
Adjusted Initial Claims for Unemployment Benefits (UB), after rising for the previous two months, declined in December to 16,039. The annual average for the year was 16,306 which was down 0.3 percent from the 16,363 annual average in 2017. The 16,306 initial claims annual average was the ninth lowest dating back to 1970. But 2018 was a record setting year after adjusting for wage and salary employment growth. The record low annual average initial claims level of 14,138 was in 1973, but total employment was only 1.4 million compared to the 2.9 million in 2018.