by Dave Senf
August 2014
Note: All data except for Minnesota's PMI have been seasonally adjusted. See the feature article in the Minnesota Employment Review, May 2010, for more information on the Minnesota Index.
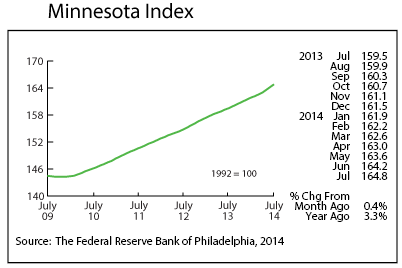
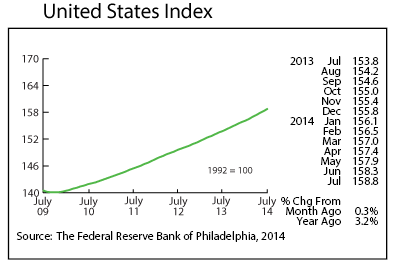
The Minnesota Index increased 0.4 percent for the second straight month in July, indicating that Minnesota's economy is picking up speed. Minnesota's economy expanded slightly faster than the U.S. economy as the U.S. index increased 0.3 percent for the sixth consecutive month. Economic activity in the state has been increasing faster than the U.S. economy over the last few months based on the two indices after lagging earlier in the year. Two of the four components of Minnesota's index - nonfarm payroll employment and average weekly manufacturing hours - slipped slightly in June. Another component, the state unemployment rate, was unchanged. The final component, real wage and salary disbursements, increased which boosted the index.
Minnesota's index in July was up 3.3 percent from a year ago compared to a 3.2 percent increase nationwide. Both indices are monthly proxies for the economic growth that is subject to significant revisions as more reliable data become available.
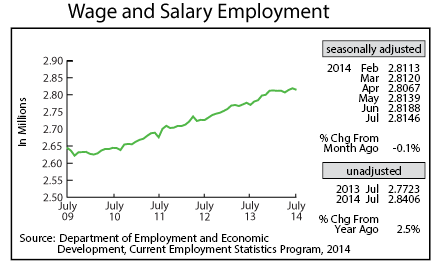
Minnesota's adjusted Wage and Salary Employment stumbled in July, dipping 4,200 jobs. Almost all of the job loss was in the private sector which cut payrolls by 4,100. All job reduction occurred in the service-providing side of the economy; goods-producing employment was unchanged from the previous month. Educational and Health Services was the main job cutter, reducing payrolls by 5,300. Another 1,000 jobs were cut in Information. The job picture wasn't all bad: Trade, Transportation, and Utilities (1,600), Manufacturing (700), and Leisure and Hospitality (600) added workers.
Minnesota job growth over the year, using unadjusted job numbers, soared to 2.5 percent, the highest jump since September 2011. At the national level job growth was up 1.9 percent from a year ago.
Minnesota's adjusted online Help-Wanted Ads climbed in July, jumping to the second-highest total ever recorded over the 10 years of data. Job ads in the state increased 3.7 percent in July while U.S. ads dipped 0.3 percent. Minnesota's share of online help-wanted ads rose to 2.5 percent in July, continuing to exceed the state's 2.0 percent share of national employment. This indicates that demand for workers remains relatively stronger in Minnesota than nationally.
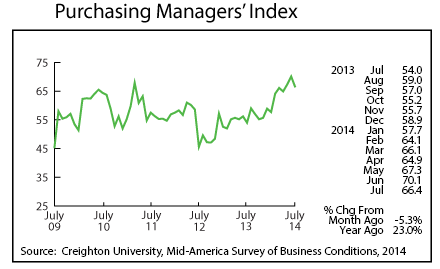
Minnesota's Purchasing Managers' Index (PMI) retreated in July, tailing off from 70.1 in June to 66.4 in July. Despite the drop-off the index remains healthy and continues to point toward solid economic gains over the next three to six months. Minnesota manufacturers continue to be more optimistic about the near future than their counterparts in the Midwest and nationally. The nine-state Mid-American Index, which includes Minnesota, was 57.0 in July while the corresponding national index was 57.1. The employment component of Minnesota's index also remains high, indicating that the state's manufacturing workforce will be expanding over the next six months.
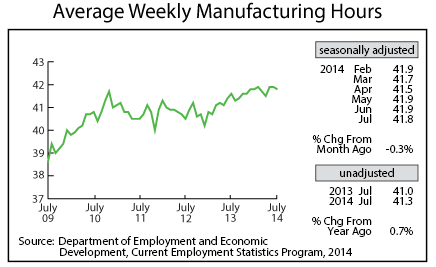
Adjusted Manufacturing Hours slipped slightly to 41.8 hours in July but remain robust. Average weekly manufacturing hours have averaged 41.8 hours over the first seven months of 2014. The highest annual average factory workweek since 1970 was in 1994 when workers averaged 41.6 hours per week. Most indicators are pointing toward 2014 topping the 1994 record.
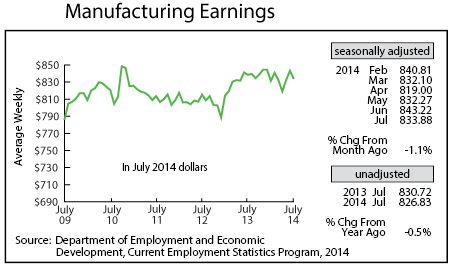
After shooting up sharply during the previous two months, Manufacturing Earnings fell in July to $833.88. July's decline pushed real weekly factory paychecks to 0.5 percent lower than a year ago. July was only the second month in the last 18 months where real manufacturing earnings were down from a year earlier.
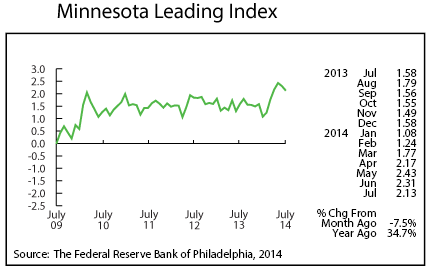
After climbing for four consecutive months between February and May, the Minnesota Leading Index has decreased for the second month in a row in July. July's 2.13 reading, however, still points toward economic expansion in Minnesota into the first quarter of 2015.
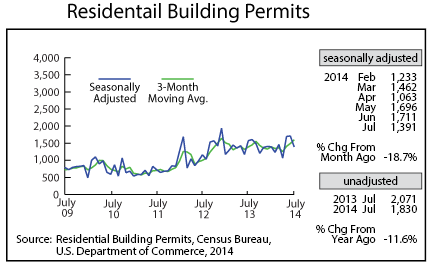
Adjusted Residential Building Permits took a step backward in July, tumbling to 1,391. Home-building activity in the state is stronger than last year but below the optimistic levels forecast at the beginning of the year. The home-building recovery in Minnesota, as nationally, has hit a few bumps in 2014. The increase in home construction this year is likely to be lower than 2013's increase.
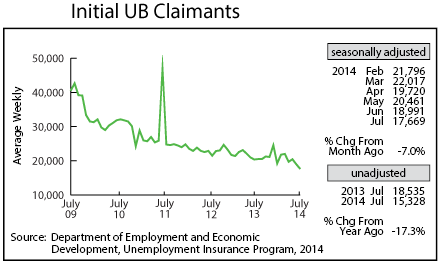
Adjusted Initial Claims for Unemployment Benefits (UB) declined for the second month in a row, receding to 17,669. That is the lowest level since September 2000. Initial claims numbers as a percent of total employment is averaging 0.7 percent this year. The only years with lower percentages were 1997-2000, the peak boom years.
