by Dave Senf
March 2014
Note: All data except for Minnesota's PMI have been seasonally adjusted. See the feature article in the Minnesota Employment Review, May 2010, for more information on the Minnesota Index.
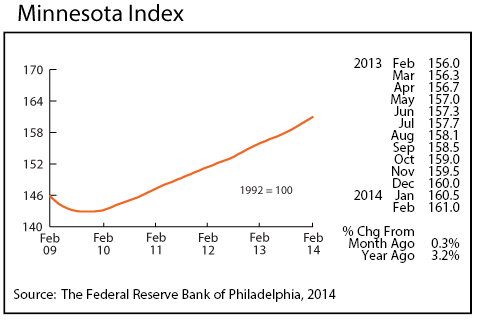
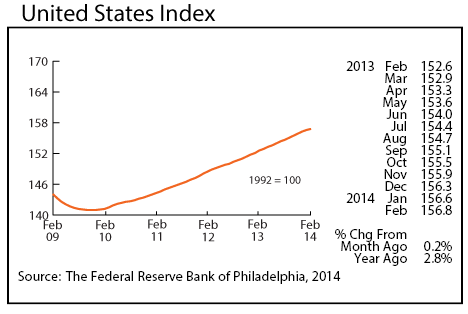
The Minnesota Index advanced 0.3 percent for the seventh straight month in February. February's advance was surprising since two of the components - wage and salary employment and the unemployment rate - were either unchanged or negative in February. Increasing income from rising wage and salary disbursements and a slight gain in average weekly manufacturing hours, the two other components, kept the index climbing last month. The U.S. index rose 0.2 percent for the third consecutive month. Minnesota's index has advanced faster than the national index in five of the last six months, indicating that the state's economy has outperformed the national economy over the last six months.
Minnesota's index was up 3.2 percent over the year compared to a 2.8 percent gain for the national index. Minnesota's economy looks to have expanded by more than 3 percent for the second year in a row last year based on the Minnesota Index increase. The advanced estimate of 2013 GDP growth for the state will be released in June. The state's GDP last grew by more than 3 percent two years in a row in 2003-04.
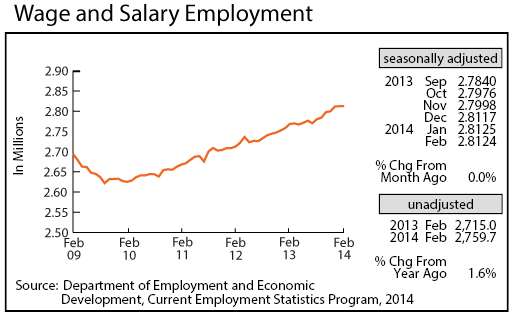
Minnesota's adjusted Wage and Salary Employment barely changed in February, inching down 100 jobs. Private Sector employment rose 900 but the gain was offset by a loss of 1,000 Public Sector jobs. Trade, Transportation, and Utilities and Information also cut 1,000 jobs. Hiring was strongest in Professional and Business Services and in Educational and Health Services. Manufacturing added jobs for the fifth consecutive month, the strongest string of factory job growth since early 2012.
Job growth over the year dropped to 1.6 percent or just a tad lower than last year's 1.7 average monthly rate. National job growth from a year ago was 1.5 percent. Job growth in Minnesota and nationally is expected to accelerate as the weather warms up.
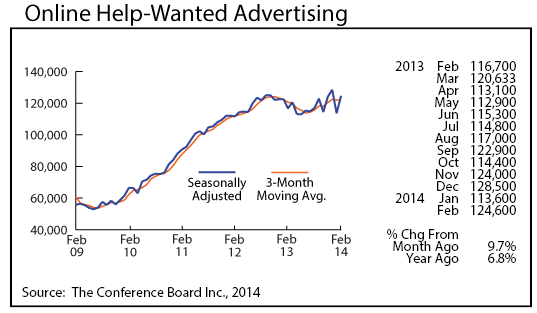
Minnesota's adjusted online Help-Wanted Ads reversed directions in February, spiking 9.7 percent. Help-wanted ads in Minnesota remain steady suggesting that hiring will continue robust enough to support job growth in the 1.5 to 1.8 percent range. U.S. help-wanted ads jumped 5.5 percent in February, leaving Minnesota's percent of national help-wanted advertising at 2.3 percent compared to 2.0 percent for national wage and salary employment. Recently released results from the fourth quarter 2013 Job Vacancy Survey show vacancies up 3.1 percent over 2012.
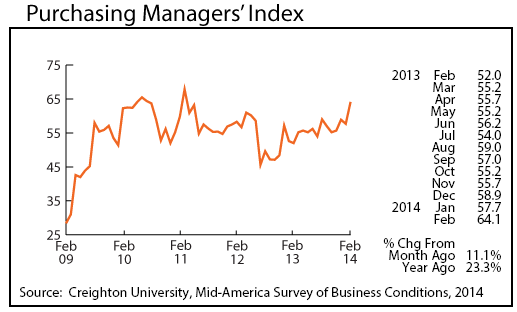
Minnesota's Purchasing Managers' Index (PMI) climbed for the third time in the last four months to 64.1. That is the highest reading in two years. The upward trend of the index points toward Minnesota's manufacturing activity continuing to expand over the next six months. Expect more manufacturing job growth during the first half of 2014.
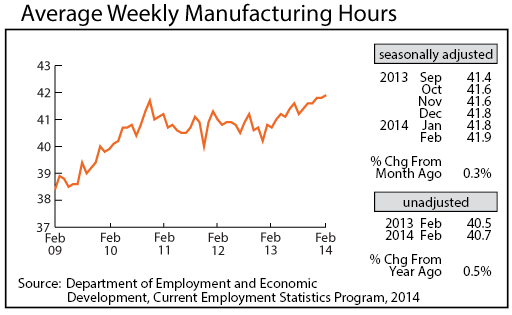
Adjusted Manufacturing Hours climbed to 41.9 hours in February, the longest workweek since March 2007. February's 41.9 hours ranks as the sixth longest seasonally adjusted factory workweek dating back to 1970. This is another indicator that manufacturers will be hiring over the next few months.
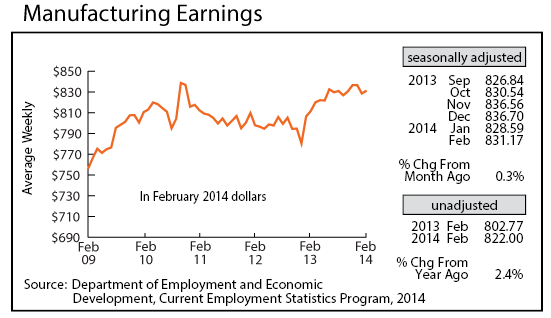
Manufacturing Earnings ticked up in February to $831.17. Factory paychecks were 2.7 percent higher in real terms than a year ago.
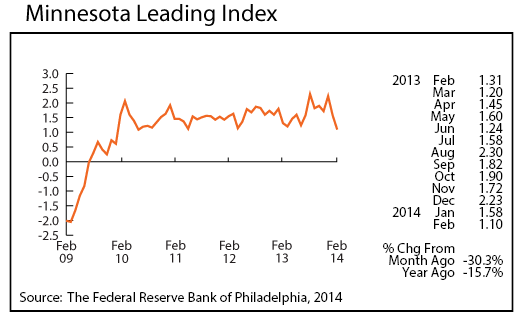
The Minnesota Leading Index dropped sharply for the second straight month, declining to 1.1, the lowest reading since June 2010. The declining readings are inconsistent with most of the other indicators. Expect this indicator to rebound in the next few months.
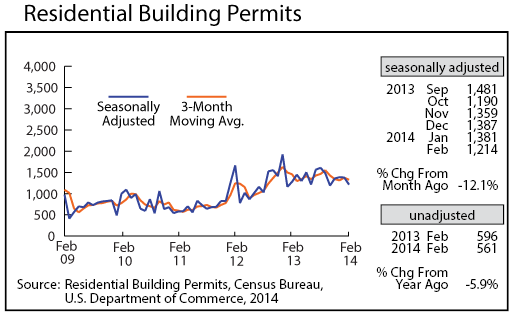
Adjusted Residential Building Permits slipped to 1,214 last month as the long winter took its toll on home building activity. Home building activity is expected to pick up over the next few months as the weather warms up. Several signs of strength were recently reported. The supply of new houses reached a 10-year low. Foreclosure rates have fallen to their lowest level in five years, and speculative home building is on the upswing.
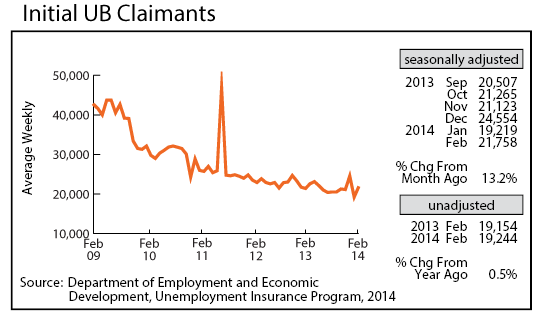
Adjusted Initial Claims for Unemployment Benefits (UB) increased 13.2 percent in February after recording a steep drop in January. The jump is probably related to the colder than normal winter. The current initial claims level is consistent with job growth remaining in the 1.5 to 1.8 percent range during the first half of 2014. Another six months of solid job growth will gradually push the state's unemployment rate down, but a slight uptick in labor force participation, brought on by the improving job market, will keep unemployment from improving faster.