by Dave Senf
August 2013
Note: All data except for Minnesota's PMI have been seasonally adjusted. See the feature article in the Minnesota Employment Review, May 2010, for more information on the Minnesota Index.
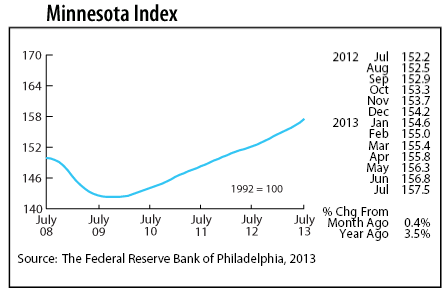
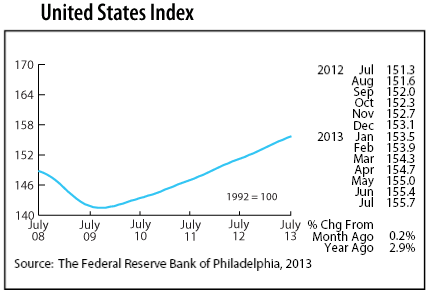
The Minnesota Index advanced for the 45th straight month in July after turning the corner from the Great Recession in November 2009. Minnesota's economy as measured by the Minnesota Index has increased 10.7 percent since the recovery began. Economic activity in the state plunged by 5.3 percent during the recession. The state's economy is roughly 4.8 percent larger than its pre-recession peak in April 2008. The U.S. index shows that the national economy has expanded 9.1 percent since the bottom. The U.S. economy dropped 5.1 percent during the recession and is roughly 4.4 percent larger than its pre-recession peak.
July's advance in the Minnesota Index was fueled by moderate job growth and a small uptick in average weekly manufacturing hours. The index was up 0.4 percent in Minnesota and 0.2 percent nationally last month. Minnesota's economy has been expanding faster than the U.S. economy for the last few months. The state's GDP has grown by 3.5 percent since last July compared to a 2.9 percent national expansion.
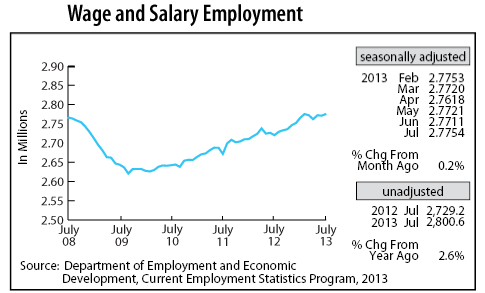
Minnesota's Wage and Salary Employment jumped by 4,300 jobs in July with jobs added in Government, Financial Activities, Leisure and Hospitality, Other Services, and Information. Job losses in Educational and Health Services, Construction, and Manufacturing held down job growth. Private payrolls grew by only 300 jobs, the smallest advance in three months.
Over-the-year job growth using unadjusted employment numbers soared to 2.6 percent, the strongest monthly pace since September 2011. Comparable national growth was 1.7 percent. Private sector job growth over the year was 2.4 percent versus 2.1 percent nationally.
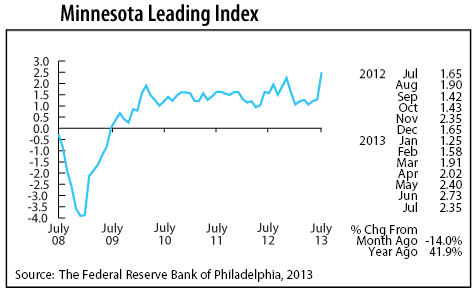
The Minnesota Leading Index retreated a tad in July, but the 2.35 reading remains robust by historical standards. The index, which forecasts the state's economic growth out six months, has exceeded 2.00 since April. If the index is two, then the economy is predicted to grow by 2 percent over the next six months, a feat not accomplished since late 1997. If the index continues to run above 2 percent, Minnesota's GDP growth for 2013 might top 4 percent. Last year the state's GDP growth was the fifth fastest at 3.5 percent.
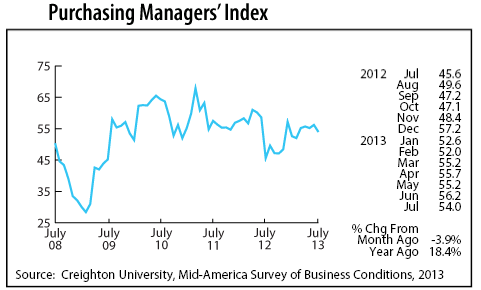
Minnesota's Purchasing Managers' Index (PMI) dipped slightly in July to 54.0. The index from a monthly survey of supply managers has now been above the growth neutral reading of 50 for eight straight months. July's reading suggests that Minnesota's economy will continue to expand at a moderate rate through the rest of the year. The employment component of the index has also been above 50 for nine consecutive months which points toward job growth continuing to run between 1.5 - 1.7 percent over the next few months.
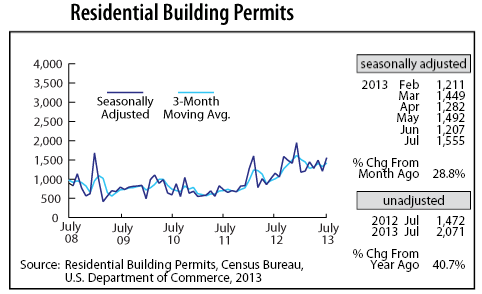
Adjusted Residential Building Permits bounced back in July, jumping 28.8 percent. Permit numbers have averaged 30 percent higher than last year through the first half of 2013, solid evidence that Minnesota's home-building market is on the mend. Home prices and sales continue to rise in the state which is a good indicator that demand for new houses will be increasing.
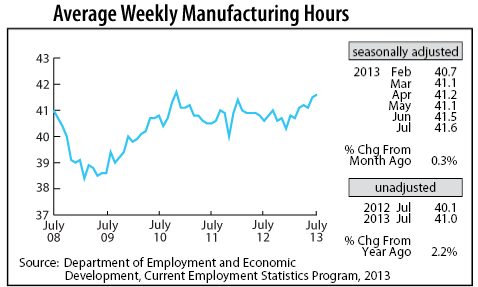
Adjusted Manufacturing Hours climbed for the second straight month to 41.7, the highest factory workweek reading since November 2010. Minnesota's factory workweek has been above 41 hours per week for five straight months. The last time that happened was late 2010 through early 2011. Higher hours usually signal a pending pickup in manufacturing hiring.
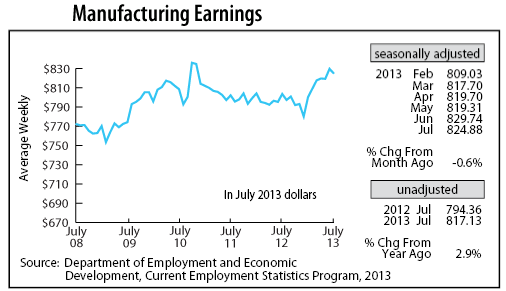
Manufacturing Earnings slipped a bit in July, sliding to $824.88, but remain elevated compared to a year ago. Factory paychecks have been on average 2.9 percent higher in real terms over the last five months. That wage gain should help boost household spending.
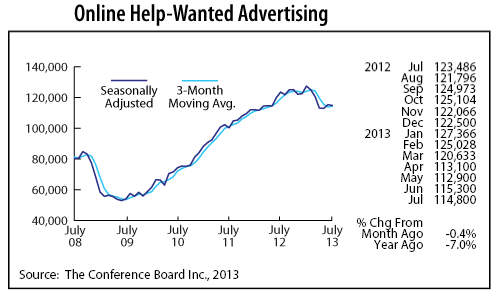
Minnesota's adjusted online Help-Wanted Ads reversed direction in July, declining for the fifth time in the last six months. Minnesota ads dropped 0.4 percent last month while declining 1.9 percent nationwide. Minnesota's online help-wanted ad level has been lower than a year ago for the last four months. This drop is inconsistent with the recently released Job Vacancy Survey. The survey estimated roughly 73,000 job openings in Minnesota in the second quarter of 2013 compared to 62,000 last year. According to the Job Vacancy Survey labor demand is up 17 percent from a year ago, not down 2 percent as suggested by the drop in online help-wanted ads.
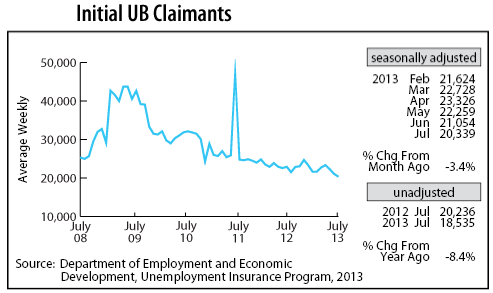
Adjusted Initial Claims for Unemployment Benefits (UB) fell for the third consecutive month, shrinking to the lowest level since January 2001. The number of Minnesota workers filing for first-time unemployment benefits is a reliable proxy for layoffs. The downward drift in initial claims is solid evidence that the job market will remain steady over the next six months.