by Dave Senf
September 2016
Note: All data except for Minnesota’s PMI have been seasonally adjusted. See the feature article in the Minnesota Employment Review, May 2010, for more information on the Minnesota Index.
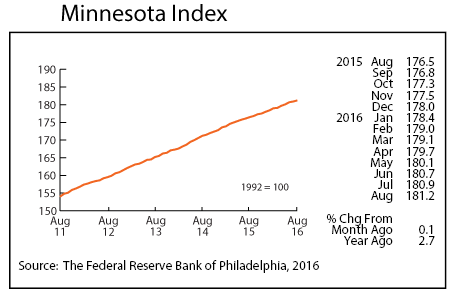
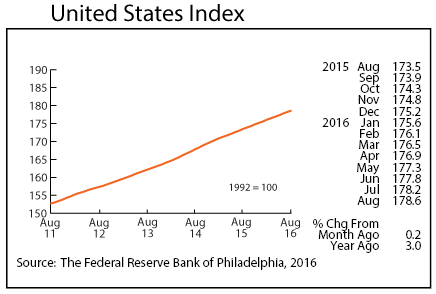
The Minnesota Index continued to inch up in August, gaining 0.1 percent for the second straight month. Falling wage and salary employment combined with the third consecutive monthly uptick in the state’s unemployment rate has limited the index’s growth rate over the last few months. The U.S. Index climbed 0.2 percent for the ninth month in a row in August.
Minnesota’s index is up 2.7 percent from a year ago while the U.S. index has gained 3.0 percent since last August. The average over-the-year growth for the Minnesota Index between 2011 and 2015 was 3.4 percent compared to 3.1 percent for the U.S. Minnesota’s index has average 2.7 percent in 2016 which is slightly behind the 3.0 percent averaged nationally. Minnesota’s economy grew faster than the national economy for the first few years after the recession but has been growing slower than the U.S. economy since 2015.
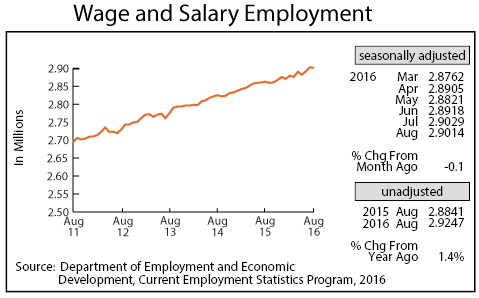
After adding over 20,000 jobs over the previous two months the Minnesota job market cooled in August as adjusted Wage and Salary Employment slipped by 1,500 jobs. Private sector employment declined by 2,100 positions while the public sector added 600 jobs. Construction, Manufacturing, and All Other Services cut the most jobs. Six of the supersectors lost jobs, one saw no change, and four added workers. Trade, Transportation, and Utilities accounted for more than half of the jobs added.
Minnesota’s year-over-year job growth rate dipped to 1.4 percent in August which again trailed the U.S. year-over-year rate of 1.7 percent. Minnesota’s annual average growth through August stands at 1.3 while the U.S. average is 1.8 percent. Minnesota’s annual job growth has lagged behind national job growth since 2014.
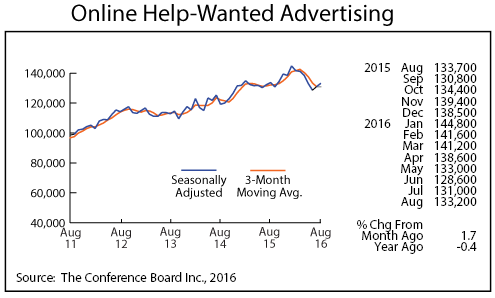
Online Help-Wanted Ads moved upwards for the second straight month, jumping to 133,200, the highest level since April. Minnesota’s online job advertising climbed 1.7 percent in August and was flat nationally. The results of Minnesota’s Job Vacancy Survey, another proxy for labor demand, covering the second quarter of 2016, were recently released. Job vacancies were down slightly from the same period in 2015, 0.4 percent, but remain robust by historical standards. Minnesota accounted for 2.8 percent of U.S. online job vacancies in August and 2.0 percent of U.S. jobs. The state has 25 percent more online help-wanted ads than would be expected given the state’s share of U.S. jobs. That ranks fifth highest behind Colorado (43 percent), Alaska (34 percent), Massachusetts (28 percent), and Montana (28 percent) when state share of online job advertising is compared to state share of jobs.
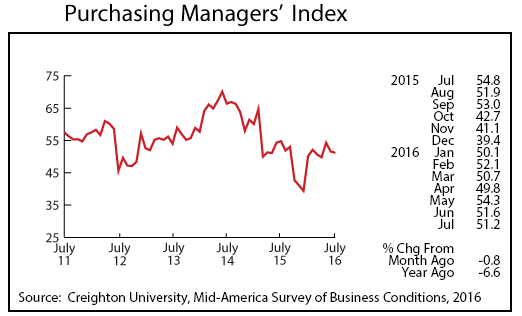
Minnesota’s Purchasing Managers’ Index (PMI) dropped for the third consecutive month in August to 49.4, the lowest reading since last December. The Mid-American Business Conditions Index which includes Minnesota and the corresponding national index, the PMI (Purchasing Manager’ Index), recorded 47.8 and 49.4 respectively in August. The sub 50 readings for all three indices indicate that manufacturing contracted in Minnesota, the Mid-American states, and nationally.
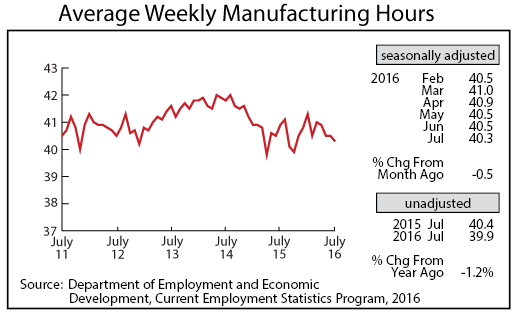
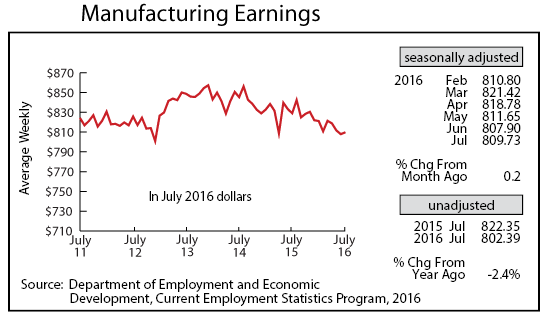
Adjusted Manufacturing Hours rebounded in August to 40.5 hours but remain below last year’s level. Average weekly Manufacturing Earnings rose for the first time in five months to $811.50. July’s average weekly factory earnings were the lowest in over three years. Real manufacturing earnings continue to run more than 3 percent below 2015 earnings. Minnesota manufacturers have expanded payroll numbers every year since 2011, but unless hiring picks up during the last part of 2016 manufacturing employment will be flat for the year.
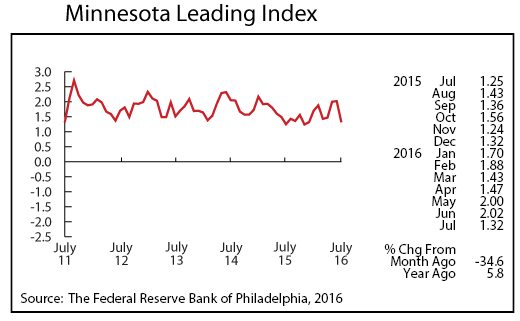
The Minnesota Leading Index plunged for the second straight month, falling to its lowest reading since September 2010. August’s reading of 0.85 implies that Minnesota’s economic growth over the next six months will slow substantially. This indicator has given off false one-month warnings in the past so expect a jump in the leading index next month as data revisions come in.
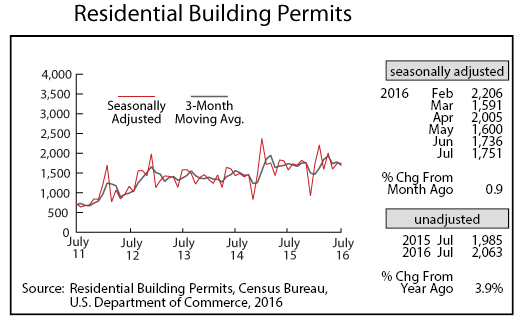
Adjusted Residential Building Permits, after being somewhat disappointing during the first half of the year, surged in August to their third highest monthly total in over 10 years. August’s 2,094 building permits were 17.1 percent higher than in July and 26.9 percent above a year ago. Unless home building picks up during the last few months of 2016, home building activity for the year will come in at roughly 2015’s level.
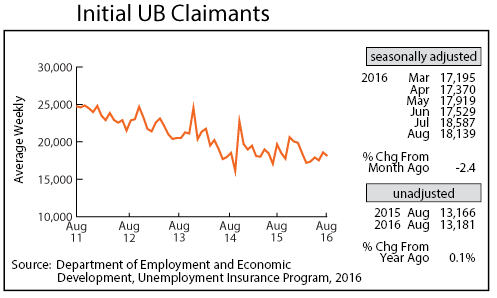
The number of Minnesotans filing new applications for jobless benefits inched down in August to 18,139. Minnesota’s Initial Claims for Unemployment Benefits (UB) remain historically low, continuing to signal that the state’s layoff rate remains in check even as hiring slows slightly.
