by Dave Senf
October 2019
Note: All data except for Minnesota’s PMI have been seasonally adjusted. See the feature article in the Minnesota Employment Review, May 2010, for more information on the Minnesota Index.
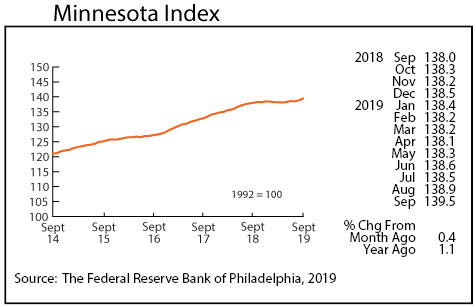
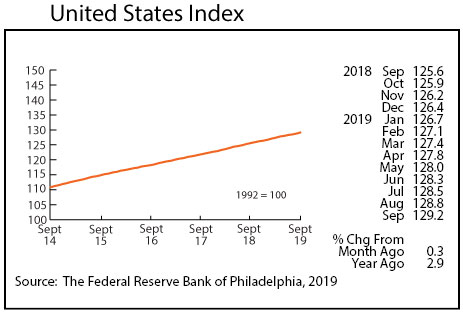
The Minnesota Index climbed for the second straight month, advancing 0.4 percent in September. That was the highest monthly gain of the year. The index’s climb was fueled by increasing average weekly manufacturing hours for production workers, higher real wage and salary disbursements, and a slight drop in Minnesota’s unemployment rate. The U.S. index increased by 0.3 percent in September, so Minnesota’s index has risen faster than the U.S. index the last two months.
The September reading was 1.1 percent higher than a year ago compared to the U.S. annual gain of 2.9 percent. Minnesota’s economic growth over the first half of the year was mild relative to U.S. growth but appears to be catching up during the last few months.
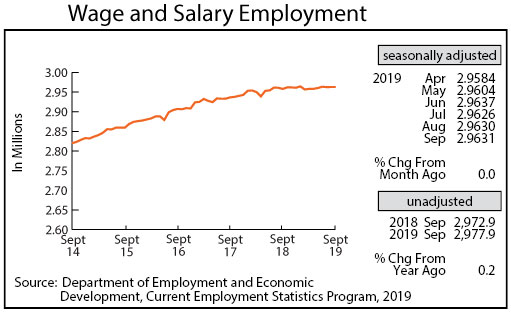
Adjusted Wage and Salary Employment was flat in September with employment increasing by only 100 jobs. Private sector employment was up 500 jobs, but public sector jobs were down 400. Seasonally adjusted wage and salary employment has increased by only 2,000 jobs so far in 2019. The state added 15,300 jobs during the first nine months of 2019. Minnesota added 18,100 jobs over the same period in 2018. Job estimates from October 2018 to September 2019 will be benchmarked (revised) in March next year. Revision are expected to show higher job growth than currently reported, but annual job growth will be down for the fourth straight year.
Private sector job growth was concentrated in Trade, Transportation, and Utilities and in Financial Activities. Gains in those sectors, however, were offset by job loss in Educational and Health Services and Professional and Business Services. Over-the-year job growth for the state using unadjusted job numbers was a measly 0.2 percent compared 1.5 percent nationally.
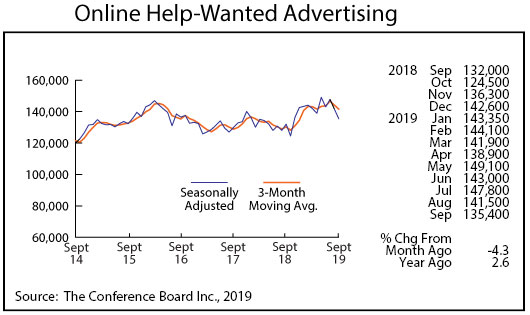
Online Help-Wanted Ads dropped by 4.3 percent for the second month in a row in September to 135,400. That is the lowest level since last October. Job postings nationally tailed off 2.0 percent in September. September’s job posting level in the state remains solid though, as the average monthly level since 2015 is 135,439 which is right around September’s level.
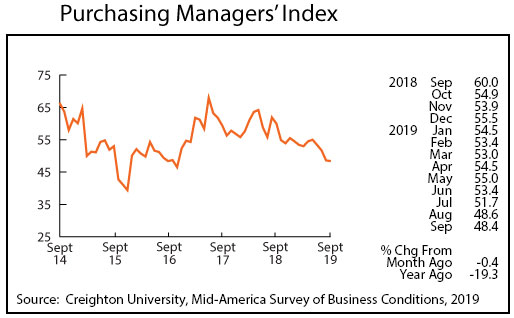
Minnesota’s Purchasing Managers’ Index (PMI) dipped for the fourth straight month to 48.4, but the decline was much smaller than over the previous three months. The other two comparable indices also fell with the Mid-America Business Index slipping to 49.1 and the Institute of Supply Management’s national PMI sliding to 47.8. Manufacturing across the U.S. and Minnesota has contracted over the last two months from the tariffs wars and slowing global economic growth.
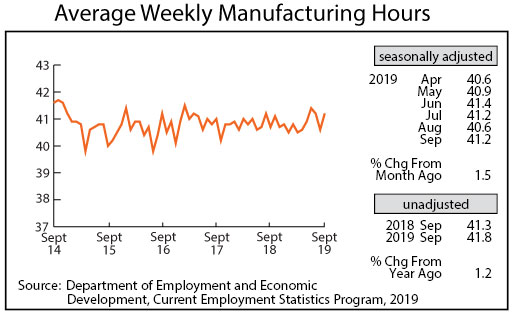
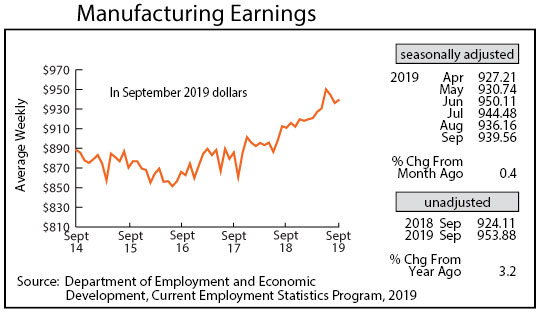
Adjusted average weekly Manufacturing Hours, after slipping sharply in August, spiked up in September to 41.2 hours. The longer factory workweek is inconsistent with a weak manufacturing sector. After tailing off for two consecutive months, average weekly Manufacturing Earnings, adjusted for inflation and seasonality, rose to $939.56. Real manufacturing earnings, adjusted for inflation and seasonally, were up 3.1 percent from last September.
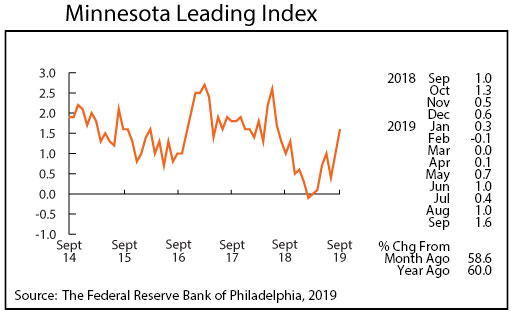
The Minnesota Leading Index advanced sharply for the second straight month to 1.6, its highest reading in 15 months. The 37-year monthly average is 1.4, so the 1.6 reading suggests that the pace of economic growth in the state over the next six months will be slightly above the long-term average rate. The 1.6 reading suggest that Minnesota’s economic growth is picking up speed after modest growth for much of 2019. Minnesota’s leading index for September ranked 15th highest among the states.
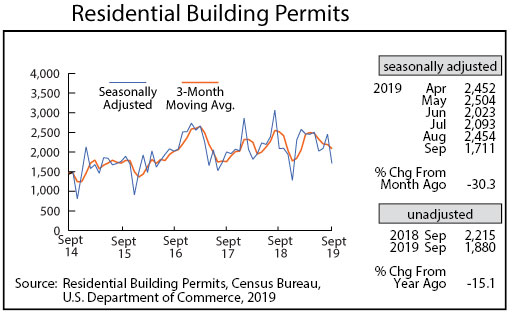
Residential Building Permits plunged to 1,711 in September, the lowest level of the year. Minnesota home building permits accounted for only 1.6 percent of all U.S. home building permits in September compared to the 2.1 percent through the first nine months of the year. Despite September’s decline in home-building permits, Minnesota’s home building activity in 2019 is on track to finish solidly ahead of 2018 activity.
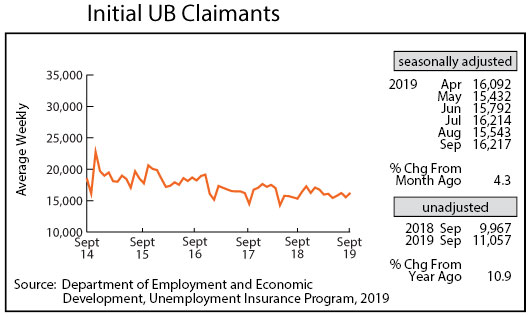
Seasonally Adjusted Initial Claims for Unemployment Benefits (UB) zigzagged up in September to 16,217. Initial claims for the first nine months of the year were 0.6 percent lower than during the same period in 2018. Initial claims remain exceedingly low by historical standards. Layoffs remain low as employers who are having a hard time finding new workers remain reluctant to let any of their workforce go. The low layoff rate in Minnesota lends support to the agreement that slow job growth is related to an extremely tight labor market rather than to any drop in demand for workers.
