by Chet Bodin
April 2016
Recently released data from the American Community Survey (ACS) brought racial disparities in Minnesota’s economy to the forefront, with much of the focus initially placed on the low incomes and high unemployment rates for Black or African American residents in the Twin Cities metro area. But unemployment rates vary by race across the state, and Northwest Minnesota faces workforce challenges that are distinct from other regions.
Just as Blacks find specific barriers to employment in the metro area, there are also significant employment disparities for American Indians in Northwest Minnesota. Statewide, unemployment rates for American Indian and Alaska Natives were even higher than for Blacks, so if race is the framework used to assess workforce development needs, a sense of urgency is appropriate for the American Indian community as well.
With nearly 22,000 people, well over one-third (37.6 percent) of the state’s American Indian population lives in the 26-county Northwest Minnesota region, including about 15,000 people residing on the Red Lake, Leech Lake, and White Earth reservations. In comparison, only 10.3 percent of the state’s total population lives in the Northwestern part of the state.
American Indians are the largest minority group in Northwest Minnesota, and they have the highest unemployment rate. Statewide the 2010 to 2014 unemployment rate estimate for American Indians was 17.4 percent compared to 16.4 for Black or African Americans. In Northwest Minnesota the rate for American Indians was 21.6 percent, 15 points higher than that of the region’s overall population (see Table 1).
| Northwest Minnesota Employment Characteristics by Race and Origin, 2014 | ||||||||
|---|---|---|---|---|---|---|---|---|
| Race and Hispanic Origin | Northwest Minnesota | Twin Cities | Minnesota | |||||
| Labor Force | Labor Force Participation Rate | Unemployment Rate | Labor Force Participation Rate | Unemployment Rate | Labor Force | Labor Force Participation Rate | Unemployment Rate | |
| Total Labor Force | 286,124 | 64.6% | 6.2% | 72.3% | 6.8% | 2,977,637 | 70.1% | 6.5% |
| White alone | 267,956 | 64.7% | 5.5% | 72.7% | 5.6% | 2,607,068 | 70.2% | 5.6% |
| Black or African American | 1,836 | 62.6% | 15.1% | 69.5% | 16.2% | 137,313 | 68.0% | 16.4% |
| American Indian and Alaska Native | 8,852 | 61.5% | 21.6% | 60.9% | 15.8% | 24,118 | 59.4% | 17.4% |
| Asian and Other Pacific Islander | 2,157 | 70.7% | 5.8% | 70.4% | 7.6% | 121,498 | 70.6% | 7.2% |
| Some Other Race | 1,647 | 68.1% | 12.0% | 77.5% | 10.7% | 39,691 | 76.2% | 11.0% |
| Two or More Races | 3,759 | 64.7% | 12.8% | 71.6% | 13.6% | 46,714 | 69.5% | 13.2% |
| Hispanic or Latino origin | 5,845 | 70.4% | 13.5% | 77.0% | 9.3% | 125,615 | 75.0% | 10.1% |
| Source: 2010-2014 American Community Survey, 5-year estimates | ||||||||
Employment disparities and historical marginalization are deeply related and widely felt in the region, but have seen changes over time. The U.S. Census Bureau's American Community Survey (ACS) five-year estimates for 2010 to 2014 captures most of the post-recession economic recovery period and are completely independent of the 2005 to 2009 ACS estimates.
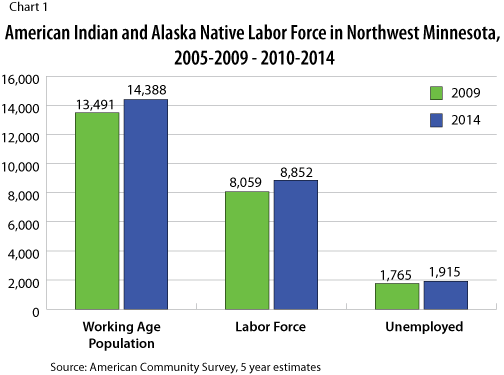
Labor force participation increased for American Indian and Alaska Natives in Northwest Minnesota after the recession. Unfortunately, so did the unemployment rate (see Chart 1). Despite regional economic growth, this trend could lead to more discouraged job seekers and less labor force participation if it continues, especially when coupled with the endemic poverty and other social barriers unique to the American Indian population.

High unemployment rates for American Indian communities is clearly a regional and state concern, with certain segments of their population facing more difficulty than others. American Indians between 16 and 64 years of age living on the Leech Lake, Red Lake, and White Earth reservations had an estimated 25 percent unemployment rate over the past five years, despite a nearly 70 percent labor force participation rate. Both rates were higher on the reservations than the rest of the region (see Table 2).
| Northwest Minnesota American Indian and Native Alaskan Employment, 16-64 years of age, 2014 | ||||
|---|---|---|---|---|
| - | Population, 16-64 years | In Labor Force, 16-64 years | Labor Force Participation Rate | Unemployment Rate |
| Northwest Minnesota | 12,979 | 8,549 | 65.9% | 22.3% |
| Leech Lake, Red Lake, and White Earth Reservations | 7,989 | 5,503 | 68.9% | 24.9% |
| Source: 2010-2014 American Community Survey 5-year estimates | ||||
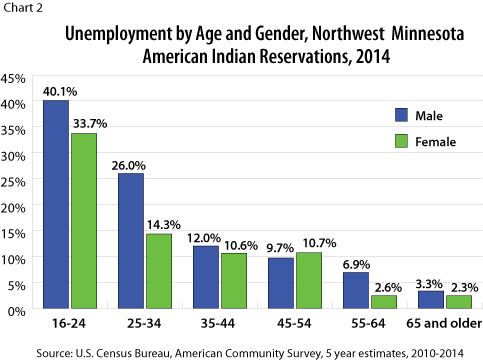
It appears the high unemployment in younger American Indian populations – particularly among 16- to 34-year-old males – is driving overall trends. At nearly every age, American Indian men experience higher unemployment rates than women on Northwest Minnesota American Indian reservations (see Chart 2).

The largest unemployment disparity between genders is found in the 25- to 34-year-old age group, where unemployment for men is almost 12 percentage points higher (26.0 percent) than for women (14.3 percent). However, this age group does not have the highest unemployment rates. Males from 16 to 24 years of age living on the reservations registered over 40 percent unemployment, and females in the same age group did not fare much better, registering a 33.7 percent unemployment rate. Conversely, both genders see unemployment rates fall rapidly after age 35, even dropping to the single digits over 55 years of age.
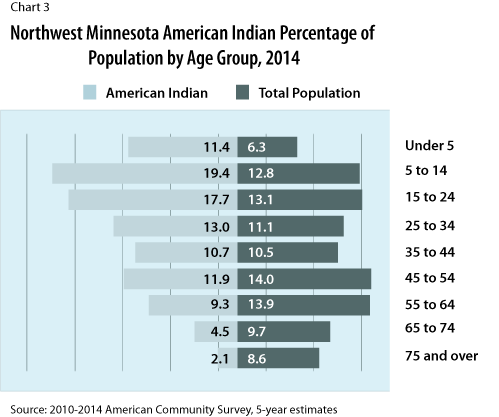
This drop can partly be explained by the age profile of the American Indian and Native Alaskan community in Northwest Minnesota. Nearly half (48.5 percent) of the American Indian population is less than 25 years old, compared to just one third (32.2 percent) of the total population. On the other end of the age spectrum, another third (32.2 percent) of the Northwest population was 55 years or older and will be retiring or approaching retirement age in the next 10 years. For American Indians, just under 16 percent were 55 years and older in 2014 (see Chart 3).

Efforts to end the unemployment disparities are underway, with several opportunities for in-demand career training and postsecondary education available on Northwest Minnesota reservations. Post-secondary and adult learning programs at the Leech Lake Tribal College, Red Lake Nation College, and White Earth Tribal and Community College, all located on reservations, are training job seekers across the Ojibwe nation. For example, the Northwest Indian Opportunities Industrialization Center's recent grant from the Minnesota Job Skills Partnership's Low Income Worker Training Program is designed to address the employment disparities between American Indians and other ethnic populations in Northwest Minnesota by funding health care training on the Leech Lake and Red Lake reservations.
The Northwest Indian Opportunities Industrialization Center (NWOIC) program is an excellent example of how targeted job training can simultaneously address social needs and the persistent unemployment that harms the region's American Indian population, while also providing workers who are in high demand from local employers. Data from DEED's Occupations in Demand tool shows that both certified nursing assistants (CNAs) and home health aides are among the most needed occupations in the region. In addition, it's estimated that over 2,300 CNA and home health aide positions will open up in the Northwest Minnesota planning region by 2022. The most recent Job Vacancy Survey shows 620 job vacancies for healthcare support occupations (see Table 3).
| Northwest Minnesota Job Vacancy Survey Results, Qtr. 4 2015 | |||||||
|---|---|---|---|---|---|---|---|
| Occupation | Job Vacancies | Job Vacancy Rate | Median Wage Offer | Percent Part-time | Percent Requiring Post-secondary Education | Percent Requiring Work Experience | Percent Requiring Certificate or License |
| Total, All Occupations | 8,251 | 3.8% | $12.19 | 39% | 33% | 30% | 40% |
| Healthcare Support Occupations | 620 | 7.5% | $11.94 | 37% | 74% | 8% | 84% |
| Nursing Assistants | 396 | 9.8% | $12.01 | 45% | 75% | 7% | 90% |
| Massage Therapists | 125 | N/A | $10.85 | 0% | 99% | 1% | 100% |
| Home Health Aides | 66 | 2.5% | $11.47 | 49% | 8% | 2% | 14% |
| Physical Therapy Assistants | 6 | 7.4% | $16.01 | 59% | 100% | 17% | 100% |
| Production Occupations | 641 | 2.6% | $13.15 | 4% | 14% | 27% | 12% |
| Assemblers and Fabricators | 200 | N/A | $13.36 | 4% | 8% | 1% | 6% |
| Welders, Cutters, Solderers, and Brazers | 96 | 8.2% | $14.49 | 11% | 27% | 37% | 31% |
| Computer-Controlled Machine Tool Operators, Metal | 57 | 8.2% | $12.96 | 0% | 30% | 32% | 1% |
| Machinists | 14 | 1.0% | $16.46 | 0% | 78% | 68% | 92% |
| Source: DEED Job Vacancy Survey, Qtr. 4 2015 | |||||||
Although the NWIOIC health care grant offers opportunities for men to train in non-traditional occupations, females still greatly outnumber males in these occupations. In contrast, American Indian men outnumber women by more that 3-to-1 statewide in production occupations. In light of this, the Minnesota Job Skills Partnership board are also funding two welding training programs that target American Indians in production occupations – one on a reservation and one off. In total, the programs will train almost 80 workers from low-income backgrounds and connect the training to both the regional manufacturing and construction industries. The program has potential to serve the young male demographic which registers the highest levels of unemployment on reservations and fill regional workforce needs.
As shown in Table 3, employers in Northwest Minnesota reported nearly 650 production occupation vacancies in the fourth quarter of 2015. Overall, just 14 percent of those openings required post-secondary education, although that varied greatly by occupation. For example, 78 percent of the machinist vacancies and about 30 percent of the openings for both welders and computer-controlled machine tool operators require post-secondary education. Those occupations also tended to offer higher wages.
Training programs like these aim to chip away at economic disparities in Northwest Minnesota's American Indian communities. Persistently high unemployment and low labor force participation rates can be changed with job placement in an improving economy, but they are also symptoms of long-standing social challenges such as poverty, substance abuse, and low educational attainment. DEED and other statewide organizations are able to provide research and financial support when appropriate, but local tribes understand their workforce challenges more intimately. Leveraging the vast cultural wealth in American Indian communities to reverse these trends only occurs when tribal officials, educators, and industries are engaged in mitigating the economic and social barriers that keep young American Indians out of work.