by Mark Schultz
June 2018
Health care and social assistance and the manufacturing sector dominated business expansion projects in the region during the last five years.
Employers in Southeast Minnesota added 6,651 jobs from 2013 to 2017, an increase of 2.8 percent. Many businesses in the region launched expansion projects during that period, accounting for a significant number of the new jobs.
Some of these expanding businesses declared their intentions through media reports, public announcements or their work with DEED, allowing them to be gathered and reported in DEED’s Publicly Announced Business Expansions data tool. While not a comprehensive listing, the data show that there were 59 business expansions in the 11 counties of Southeast Minnesota from first quarter 2013 through first quarter 2018. Table 1 shows a breakdown of those projects by industry.
| Table 1. Publicly Announced Business Expansions, Southeast Minnesota, 2013 Q1 - 2018 Q1 | ||||
|---|---|---|---|---|
| Industry | Number of Expansions | Investment | New Jobs | New Square Feet |
| Food and Beverage Mfg. | 11 | $246M | 240 | 804,217 |
| Fabricated Metal Product Mfg. | 8 | $28M | 177 | 236,000 |
| Health Care and Social Assistance | 6 | $330M | 280 | 419,000 |
| Other Miscellaneous Mfg. | 5 | $15M | 172 | 145,000 |
| Plastics and Rubber Mfg. | 4 | $16M | 286 | 78,000 |
| Nonmetallic Mineral Product Mfg. | 4 | $40M | 29 | 325,000 |
| Machinery Mfg. | 4 | $12M | 79 | |
| Telecommunications | 3 | 340 | 80,000 | |
| Agriculture | 2 | $16M | 76,000 | |
| Construction | 2 | $1M | 24 | 19,000 |
| Computer and Electronic Product Mfg. | 2 | $2M | 172 | 18,000 |
| Medical Equip. and Supplies Mfg. | 2 | 33 | 15,000 | |
| Arts, Entertainment and Recreation | 2 | $105M | 170 | 224,000 |
| Textile Product Mills | 1 | 30 | ||
| Chemical Mfg. | 1 | 10 | ||
| Furniture and Related Product Mfg. | 1 | $3M | 70 | 14,990 |
| Transportation/Warehousing | 1 | 40 | 20,000 | |
| Total | 59 | $814M | 2,152 | 2,474,207 |
| Source: DEED Publicly Announced Business Expansions | ||||
Manufacturing accounted for 43 of the 59 expansion projects. This is not surprising given that Southeast Minnesota is a manufacturing powerhouse, with the industry representing the second-largest number of jobs in the region. Manufacturing accounts for 15.8 percent of total employment, 5.6 percent of total business establishments and 18.2 percent of total payroll.
More specifically, 11 subsectors within manufacturing saw business expansions in the past five years, including manufacturing of food and beverages, fabricated metal products, plastic and rubber products, nonmetallic mineral products, machinery, computer and electronic products, medical equipment and supplies, textiles, chemicals, furniture, and other miscellaneous manufacturing. These 11 subsectors account for 86.1 percent of the manufacturing jobs in Southeast Minnesota. These expansions appear to have strengthened the manufacturing landscape in the region.
The available data show that the region was expected to see a minimum of $814 million invested in expansions, with investments in individual projects ranging from $1 million to the $217 million that was planned at Mayo Clinic Health System in Rochester in 2017.
The publicly announced expansions also were reported to account for at least 2,152 new jobs in the region, even though 19 of the expansions did not provide a job growth estimate. Individual projects ranged from a low of four jobs to a high of 280 new jobs at Mayo Clinic.
Most impressively, the expansions trumpeted the addition of no less than 2.47 million square feet, with projects varying from 5,000 square feet to the 590,000 square feet planned at Faribault Foods in Faribault.
Health care and social assistance accounted for the most expansion investments, with a minimum of $330 million invested. That would be expected given that this sector is the top-employing industry in Southeast Minnesota. Health care and social assistance accounts for 26.4 percent of the total jobs, 9.4 percent of the employing firms and 35.6 percent of the total regional payroll.
It comes as no surprise that the bulk of this was due to expansions at Mayo Clinic Health Systems, which dominates the industry in the region. One Mayo project alone resulted in an investment of $217 million, the creation of 280 jobs and the addition of 254,000 square feet. Two other projects added another $113 million in investment and 160,000 square feet, according to the Publicly Announced Business Expansions data.
Despite these expansions, a few of these industries actually saw job declines during the five-year period, including textile product mills, medical equipment and supplies manufacturing, and computer and electronic product manufacturing. These job cuts were minimal, however, compared with the overall gains in other subsectors. Several subsectors saw an increase of more than 500 jobs, including nonmetallic mineral manufacturing, machinery manufacturing, and telecommunications.
Construction saw a jump of over 1,090 jobs, while health care and social assistance led the way with a gain of almost 3,800 net new jobs. Additionally, two industries saw their job numbers more than double, with beverage manufacturing increasing by 115.1 percent and telecommunications seeing a rise of 138.5 percent (see Table 2).
| Table 2. Southeast Minnesota Industry Employment Statistics, 2013-2017 | ||||||
|---|---|---|---|---|---|---|
| Industry | 2013 Jobs | 2017 Jobs | 2013-2017 Numeric Change | 2013-2017 Percent Change | 2017 Firms | 2017 Total Payroll |
| Total, All Industries | 235,160 | 241,811 | 6,651 | 2.8% | 12,104 | $12,023,033,370 |
| Agriculture, Forestry, Fishing and Hunting | 3,009 | 3,136 | 127 | 4.2% | 385 | $103,449,400 |
| Construction | 8,232 | 9,322 | 1,090 | 13.2% | 1,409 | $517,511,182 |
| Food Manufacturing | 10,209 | 10,639 | 430 | 4.2% | 111 | $560,960,163 |
| Beverage and Tobacco Product Mfg. | 86 | 185 | 99 | 115.1% | 13 | $4,945,197 |
| Textile Product Mills | 633 | 611 | -22 | -3.5% | 14 | $33,668,686 |
| Chemical Manufacturing | 992 | 1,209 | 217 | 21.9% | 22 | $85,307,365 |
| Plastics and Rubber Products Mfg. | 1,114 | 1,247 | 133 | 11.9% | 26 | $59,527,730 |
| Nonmetallic Mineral Product Mfg. | 2,048 | 2,640 | 592 | 28.9% | 44 | $149,786,024 |
| Fabricated Metal Product Mfg. | 4,074 | 4,085 | 11 | 0.3% | 123 | $211,865,893 |
| Machinery Manufacturing | 3,538 | 4,068 | 530 | 15.0% | 63 | $225,285,719 |
| Computer and Electronic Product Mfg. | 5,288 | 4,654 | -634 | -12.0% | 29 | $439,471,939 |
| Furniture and Related Product Mfg. | 1,315 | 1,434 | 119 | 9.0% | 44 | $74,394,478 |
| Medical Equipment and Supplies Mfg. | 368 | 120 | -248 | -67.4% | 20 | $6,075,962 |
| Other Miscellaneous Mfg. | 1,692 | 1,905 | 213 | 12.6% | 48 | $78,467,766 |
| Transportation and Warehousing | 7,323 | 7,496 | 173 | 2.4% | 566 | $319,106,783 |
| Telecommunications | 675 | 1,610 | 935 | 138.5% | 67 | $98,649,193 |
| Health Care and Social Assistance | 60,127 | 63,915 | 3,788 | 6.3% | 1,139 | $4,274,558,480 |
| Arts, Entertainment and Recreation | 3,528 | 3,975 | 447 | 12.7% | 235 | $97,118,367 |
| Source: DEED Quarterly Census of Employment and Wages | ||||||
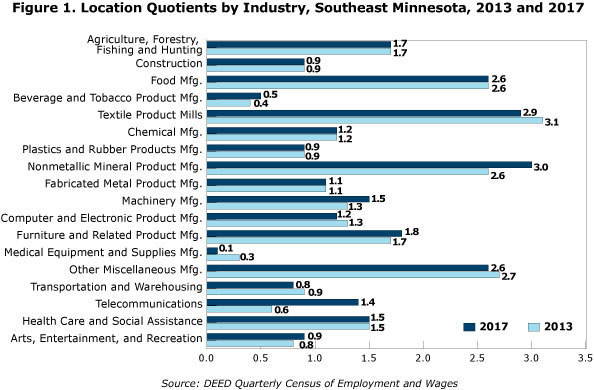
Of the 18 subsectors with publicly announced business expansions over the last five years, 11 already had location quotients over 1.0 in 2013, showing a higher industry concentration of jobs in the region than the state as a whole. Location quotients (LQs) over 1.0 can indicate that these industries have some kind of unique strength or competitive advantage in the region. Three of these subsectors saw their LQ increase from 2013 to 2017, including nonmetallic mineral product manufacturing, machinery manufacturing, and furniture and related product manufacturing. In addition, five other subsectors saw no change in their already high LQs (see Figure 1).

In contrast, three of these distinguishing industries saw a slight decline in concentration, with textile product mills dropping from an LQ of 3.1 in 2013 to 2.9 in 2017, other miscellaneous manufacturing moving from 2.7 to 2.6, and computer and electronic product manufacturing decreasing from 1.3 to 1.2. In part because of expansions, the region also saw telecommunications jump from an LQ under 1.0 to an LQ of over 1.0, meaning that it became more concentrated in the region than it is statewide over the period.
The remaining subsectors were characterized by lower regional concentrations in 2013, but two of them – beverage manufacturing and arts, entertainment and recreation – saw slight increases in their concentration relative to statewide in 2017, while medical equipment and supplies manufacturing and transportation and warehousing saw declines.
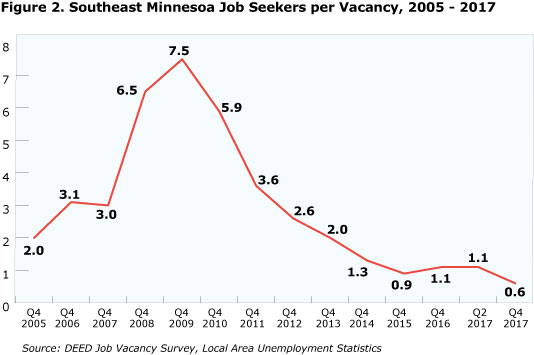
While expansion of businesses and job growth are usually seen as a positive, Southeast Minnesota currently has the lowest job-seeker-per-vacancy ratio in the state at 0.6 to 1, meaning that for every 10 vacancies there are only six unemployed people actively seeking work (see Figure 2). As a result, businesses that are planning to expand may find it difficult to fill the new jobs. There is the potential for hiring difficulties to be amplified depending on the type of jobs that are created. Lower-paying jobs, part-time jobs or temporary jobs might not have as much appeal for job seekers.

Employers in the Southeast region are already struggling to fill vacancies. It is highly possible that expanding and creating jobs in the future will be met with additional hiring difficulties. The labor force is projected to decline by over 6,000 workers from 2020 to 2030.
Another issue that employers might face is skepticism that they can staff-up to meet demand. An employer in the region recently stated that some potential new customers might choose not to do business with them out of fear that they don't have the workforce to complete the work in a timely manner. Businesses considering expanding could face a double threat of not being able to fill new jobs and hesitance on the part of potential customers to do business with them.
For those companies looking to expand, DEED has many resources available. They include regional business and community development managers,1 workforce strategy consultants,2 small business development centers,3 the Minnesota Trade Office4 and Minnesota WorkForce Centers,5 among others.
DEED's website also contains a wealth of information for businesses looking to startup, finance expansions, find workers or export products, just to name a small sample of the information and resources available. A comprehensive list of information can be found on the DEED website for businesses at mn.gov/deed/business.
1Location and Expansion Assistance.
2Workforce Strategy Consultants.
3Small Business Development Centers.
4Exporting and International Trade.
5Find a WorkForce Center (WFC) Near You.