by Dave Senf
March 2017
Slow workforce growth combined with modest job growth adds up to tight labor markets becoming the norm in Minnesota.
Minnesota’s annual average unemployment rate was 3.9 percent in 2016 and 3.8 percent in 2015.
The state annual average unemployment rate has been below 4 percent only 16 years since 1950 – roughly one out of every four years during the past seven decades.1 Unemployment below 4 percent in consecutive years is even more unusual, occurring over only four periods during the last seven decades.
The first was 1952-53 during the Korean War, when unemployment averaged 3.8 percent. Unemployment averaged 3.3 percent over the five-year period of 1966 and 1970, while the state’s best run of low unemployment was from 1995 through 2001, when unemployment averaged 3.4 percent for seven years.
Most of us weren’t looking for jobs or hiring employees during the 1950s or ‘60s, but many of us were around during the boom years of the late 1990s. Job ads were everywhere back then, plastered on storefronts, broadcast on radio and TV, and advertised on billboards.
The end of the ‘90s was easily the best job market in years for Minnesotans who were looking for jobs, switching careers or bargaining for higher wages. Similar signs of a tightening job market are popping up today in Minnesota. But until the unemployment rate slips below 3 percent, the current tight labor market falls short of 1999 and 2000, when unemployment averaged 2.8 percent.
Minnesota’s current labor market differs from the boom years of the 1990s in a number of ways, but one underlying trend makes today markedly different from past tight job markets: slowing labor force growth.
The tight labor market of the late 1990s surfaced after 19 consecutive years (1983 to 2001) of expanding employment. Employment, measured by household employment, climbed 37 percent during that period, or roughly 1.6 percent annually, boosted by annual average labor force gains of 1.5 percent.2
This time around, it took only seven straight years of job growth (2010 to 2016) and only a 7 percent household employment increase (slightly less than 1 percent annually) to drain most of the state’s labor slack and push unemployment below 4 percent. Labor force growth, even more so than job growth over the last seven years, has slowed, averaging just 0.5 percent.
Labor force growth in Minnesota and nationally hit an inflection point right around the turn of the century. It was no coincidence that slowing workforce growth occurred at the same time that the peak of the baby boom generation (baby boom births peaked in 1957) was 35 to 45 years old, the age bracket with the highest labor force participation rate historically.
Labor force participation also reached its high point around 2000, corresponding to the peak of the baby boomers reaching their prime working years. Much of the rise in labor force participation came from women, including Mary Richards, moving into the workforce at higher rates than in the past. More women entering the workforce also leveled off around 2000.
Slower growth in the state’s working-age population and more baby boomers entering retirement guarantees slower labor force growth over the next few decades, which in turn guarantees slower job growth.
Minnesota won’t need the roaring job growth days of the 1990s to keep unemployment rates low and workers hard to find. Slow workforce growth combined with even modest job growth adds up to tight labor markets becoming the norm rather than the exception as in the past.3
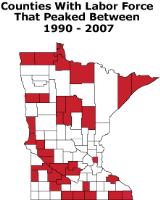
Slowing or even declining labor force growth hasn’t developed overnight. Only four Minnesota counties had smaller labor force levels in 2000 than in 1990. By 2007, however, 33 counties had already recorded their largest annual total labor force estimates (see Figure 1). The workforces in these counties peaked sometime during the 1990 to 2007 period and have been declining since. In some of those counties, the labor force is partially recovered after dropping, but not enough to top their peak labor force total.
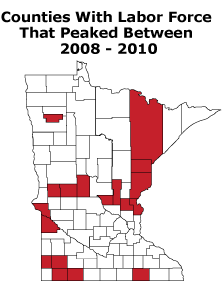
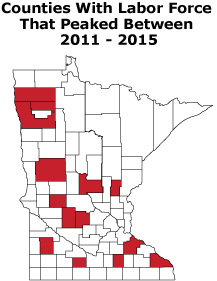
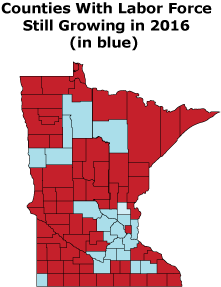
Peak labor force total was reached in 19 other counties during the Great Recession (2008 to 2010, the second map in Figure 1). The labor force in another 11 counties peaked sometime between 2011 and 2015. Only 21 counties recorded their highest labor force total ever in 2016. As displayed, most of those counties were in the Twin Cities, Rochester or St. Cloud metropolitan statistical areas. More counties will turn red in Figure 1, as peak labor force totals are reached over the next few decades if labor force projections hold.
 |
 |
 |
 |
1Unemployment and other labor force measures for Minnesota. The method of estimating Minnesota’s unemployment rate changed in 1976 so that only data from 1976 and on is online. The 1950 to 1966 data used here were judged reliable enough to gain a longer historical perspective.
2Household employment used here estimates the number of Minnesotans who are either self-employed or hold a wage and salary job across all industries including agriculture. Job data from the Current Employment Statistics (CES, also known as payroll or establishment employment), which is more commonly used, provides estimates of wage and salary employment in the state excluding agriculture employment as well as self-employment. CES employment increased by 250,000 between 2010 and 2016 compared with 182,000 in household employment.
3Minnesota’s slowing labor force growth has been covered in more detail in a number of reports, including Immigrant Workforce Report. A national perspective on the labor force slowdown.