by Erik White
December 2017

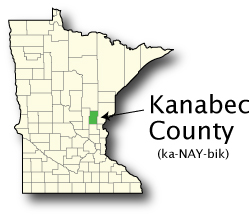
We start our tour of Minnesota counties that begin with a letter "K" with some controversy. Kanabec County, located in east central Minnesota, is named after the Ojibwe word for snake, a reference to the Snake River that flows through the county. However, the Ojibwe word is spelled ginebig, and these two words sound very similar when spoken.1
Kanabec County also owes its beginning as a county to the Ojibwe people as well as the 1837 treaty which granted the U.S. government a large swath of land in east central Minnesota, including present-day Kanabec County, to western Wisconsin in return for monetary payments. Informally known as the "White Pine Treaty", the treaty covered land that was sought by the timber industry for its stands of White Pine trees and easy transportation routes using the Snake and St. Croix Rivers to meet the burgeoning demand of westward expansion by European settlers. By the turn of the 20th century the white pine forests were gone, the lumberjacks had moved on, the county seat had been moved to Mora where the railroad was, and agriculture had become the dominant industry.2
Today 15,820 people live in the county, an increase of more than 6,000 people since 1970. There are also nearly 300 business establishments that employ about 3,900 people, and the county is a net exporter of labor as there are more workers in the county than there are jobs with people commuting to St. Cloud, Duluth, and the Twin-Cities, as well as Hinckley and Cambridge for work.
The largest sector of employment is Education and Health Services as it employs 1,318 people, increasing by 20.0 percent since 2006. Overall employment in the county has increased by 4.2 percent since 2006, with an additional 156 jobs added. Kanabec County also has a strong Manufacturing presence with nearly 500 people employed in this industry that has nearly grown by 10 percent during the past 10 years as well as through the recession.
| Economy | ||
|---|---|---|
| 2016 Estimates | Kanabec County | Minnesota |
| Population | 15,820 | 5,519,952 |
| Labor Force | 8,895 | 3,058,874 |
| Average Unemployment | 3.1% (275 people) | 2.4% (72,447 people) |
| Median Annual Earnings | $26,970 | $33,527 |
| Cost of Living, Individual | $30,808 ($14.81 per hour) | $29,856 ($14.35 per hour) |
| Cost of Living, Average Family | $53,610 ($17.18 per hour) | $55,200 ($17.69 per hour) |
| Source: DEED Local Area Unemployment Statistics Oct 2017; DEED Cost of Living in Minnesota 2017; U.S. Census Bureau, 2011-2015 American Community Survey Estimates | ||
| Industry | |||||
|---|---|---|---|---|---|
| Top Industries of Employment | 2016 Annual Data | 2006 – 2016 Percent Change | |||
| Number of Firms | Number of Jobs | Average Wage | Employment | Average Wage | |
| Total, All Industries | 296 | 3,899 | $36,400 | 4.2% | 34% |
| Education and Health Services | 39 | 1,318 | $41,080 | 20.0% | 51% |
| Trade, Transportation, and Utilities | 63 | 665 | $25,740 | -2.3% | 30% |
| Manufacturing | 18 | 476 | $38,116 | 9.4% | 16% |
| Source: DEED Quarterly Census of Employment and Wages | |||||
1The Ojibwe People's Dictionary.
2History of Kanabec County. Kanabec History Center.

To get to our next county, Kandiyohi, we could travel west on Highway 23 for about 110 miles. Or those more adventurous who also have access to a time machine could travel on a steam locomotive on the Great Northern Railroad, a system of rails that connected the Great Lakes to the Pacific Ocean with its transcontinental project completed in 1893, by getting on at a stop in Mora and getting off at Willmar, the county seat of Kandiyohi.3
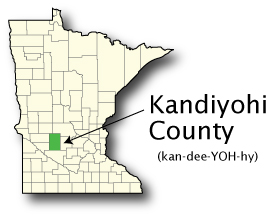
Kandiyohi County, like Kanabec, is named after an American Indian word. Kandiyohi in the Dakota language translates to, "where the buffalo fish comes" and illustrates the location of the county where prairie and lake country meet. The county was established in 1858 but the current boundary wasn't established until 12 years later when Kandiyohi and Monongalia counties merged.4
According to the U.S. Census Bureau's American Community Survey, there are nearly 5,000 Hispanics or Latinos in Kandiyohi County, constituting 11.6 percent of the total population. This is one of the greater concentration of Hispanics or Latinos in the state and is due in large part to the Jennie-O processing plant located in Wilmar and the economic opportunities provided by this turkey producing plant. During the last decade or so, a wave of immigrants from West Africa has relocated to Kandiyohi County for the economic opportunities provided. The county has more than 6 percent of its population that was born in a foreign country, highlighting its diversity.
There are 23,329 jobs in Kandiyohi County. Education and Health Services is the largest sector of employment with 30.7 percent of employment in the county. Total employment has grown by 3.5 percent since 2006, and the unemployment rate for the county was 1.8 percent in October 2017. Manufacturing has a strong role in the county. It employs about 3,500 people and has grown by 14 percent since 2006, with a gain of 429 jobs. Not only has it gained jobs and attracted new residents, Manufacturing also provides a considerably higher wage with an average annual wage of $47,528, nearly $10,000 more than the average job in the county.
| Economy | ||
|---|---|---|
| 2016 Estimates | Kandiyohi County | Minnesota |
| Population | 42,495 | 5,519,952 |
| Labor Force | 24,336 | 3,058,874 |
| Average Unemployment | 1.8% (450 people) | 2.4% (72,447 people) |
| Median Annual Earnings | $27,762 | $33,527 |
| Cost of Living, Individual | $24,704 ($11.88 per hour) | $29,856 ($14.35 per hour) |
| Cost of Living, Average Family | $43,594 ($13.97 per hour) | $55,200 ($17.69 per hour) |
| Source: DEED Local Area Unemployment Statistics Oct 2017; DEED Cost of Living in Minnesota 2017; U.S. Census Bureau, 2011-2015 American Community Survey Estimates | ||
| Industry | |||||
|---|---|---|---|---|---|
| Top Industries of Employment | 2016 Annual Data | 2006 – 2016 Percent Change | |||
| Number of Firms | Number of Jobs | Average Wage | Employment | Average Wage | |
| Total, All Industries | 1,315 | 23,329 | $37,648 | 3.5% | 27% |
| Education and Health Services | 149 | 7,183 | $35,932 | 8.4% | 15% |
| Trade, Transportation and Utilities | 341 | 4,376 | $35,100 | -6.0% | 27% |
| Manufacturing | 71 | 3,476 | $47,528 | 14.1% | 33% |
| Leisure and Hospitality | 94 | 1,742 | $15,184 | -1.1% | 46% |
| Source: DEED Quarterly Census of Employment and Wages | |||||
3GN History. Great Northern Railroad Historical Society.
4Kandiyohi County History. Kandiyohi County.

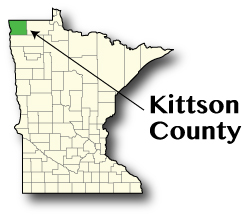
Again, we could take the Great Northern Railroad from Kandiyohi County up to the northwest corner of the state traveling through lake country and the Red River Valley where our next county is located along the border of North Dakota and Canada. Kittson County, named after fur trader and railroad entrepreneur Norman Kittson, is one of the least populated counties in the state with only 4,333 residents. With more than 1,000 square miles of land, Kittson County is also one of the least densely populated counties in the state with about 4 persons per square mile.5
With its sparse population and its location in the fertile Red River Valley, farming and agriculture is an important industry for the county. According to the U.S. Census of Agriculture there were 544 farms in the county in 2012, with crops such as soy beans, spring wheat, barley, oil sunflowers, and sugar beets grown and harvested. Over 180 million dollars of market value products was generated in 2012, a 71.4 percent increase from market value sold in 2007.
There are 180 business firms in Kittson County that provide covered employment for 1,462 people. Again, the top industry for the county is Education and Health Services which has 467 jobs with an average annual wage of $35,308. Total employment in the county has declined by 2.9 percent since 2006 following the population trend. Since 2000 the county has declined by 952 people and has been steadily losing population since its high-water mark in 1940, when the population was estimated to be 10,717.
| Economy | ||
|---|---|---|
| 2016 Estimates | Kittson County | Minnesota |
| Population | 4,333 | 5,519,952 |
| Labor Force | 2,324 | 3,058,874 |
| Average Unemployment | 1.9% (44 people) | 2.4% (72,447 people) |
| Median Annual Earnings | $29,904 | $33,527 |
| Cost of Living, Individual | $25,267 ($12.15 per hour) | $29,856 ($14.35 per hour) |
| Cost of Living, Average Family | $43,624 ($13.98 per hour) | $55,200 ($17.69 per hour) |
| Source: DEED Local Area Unemployment Statistics Oct 2017; DEED Cost of Living in Minnesota 2017; U.S. Census Bureau, 2011-2015 American Community Survey Estimates | ||
| Industry | |||||
|---|---|---|---|---|---|
| Top Industries of Employment | 2016 Annual Data | 2006 – 2016 Percent Change | |||
| Number of Firms | Number of Jobs | Average Wage | Employment | Average Wage | |
| Total, All Industries | 180 | 1,462 | $36,608 | -2.9% | 39.7% |
| Education and Health Services | 16 | 467 | $35,308 | -5.3% | 45.7% |
| Trade, Transportation and Utilities | 56 | 393 | $33,644 | 4.0% | 33.7% |
| Public Administration | 15 | 149 | $48,100 | -2.6% | 22.7% |
| Source: DEED Quarterly Census of Employment and Wages | |||||
5Kittson County History. Visit Northwest Minnesota.

To end our journey of counties that begin with a "K", we'll take Highway 11 east from Hallock and travel through the towns of Roseau, Warroad, and Baudette, tracing the northern border of the state along the Rainy River until we reach Koochiching County.
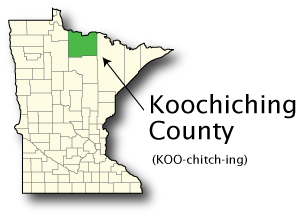
Koochiching County is the second largest county of the state, behind only St. Louis County, with more than 3,000 square miles of land, and is where the "icebox of the nation" is located, in International Falls (a.k.a. Frostbite Falls6), the county seat. The county also provides access to the state's only national park, Voyageurs National Park.
Habitation of Koochiching County dates back to before the Common Era, with evidence of the Laurel Indian tribe through their burial mounds found alongside the Rainy River. 1700 years later fur traders from both France and Great Britain began traveling through the county in their pursuit of beaver to meet the overseas demand for the fashionable hats they could be made into. However, the county was not incorporated until 1906, after splitting with Itasca County, making it the second youngest county in the state, older only than Lake of the Woods County.7
While the county is sparsely populated like Kittson County, agriculture has never been a significant industry for the county because most of the county was covered by former Lake Agassiz, a very large glacial lake, creating the swamps and peat bogs that still permeate throughout the county even though the lake receded nearly 10,000 years ago. However, timber harvesting has been important to the county which is home to a wide variety of lowland species trees-including the Tamarack, a pine tree that loses its needles in the winter but takes on a beautiful orange coloration beforehand.
Manufacturing is a key industry for Koochiching County with over 700 people employed, offering a median annual wage of more than $70,000. However, the manufacturing of paper has been on the downturn for the last decade, resulting in over 300 jobs lost since 2006. Overall employment in the county has decreased by 15 percent in that same time frame, so there are currently 4,524 jobs in the county. Education and Health Services and Leisure and Hospitality are important industries in the county with 967 and 640 people employed in them, respectively, but both recorded losses in the past 10 years.
| Economy | ||
|---|---|---|
| 2016 Estimates | Koochiching County | Minnesota |
| Population | 12,628 | 5,519,952 |
| Labor Force | 5,623 | 3,058,874 |
| Average Unemployment | 4.7% (280 people) | 2.4% (72,447 people) |
| Median Annual Earnings | $25,741 | $33,527 |
| Cost of Living, Individual | $23,491 ($11.29 per hour) | $29,856 ($14.35 per hour) |
| Cost of Living, Average Family | $41,428 ($13.28 per hour) | $55,200 ($17.69 per hour) |
| Source: DEED Local Area Unemployment Statistics Oct 2017; DEED Cost of Living in Minnesota 2017; U.S. Census Bureau, 2011-2015 American Community Survey Estimates | ||
| Industry | |||||
|---|---|---|---|---|---|
| Top Industries of Employment | 2016 Annual Data | 2006 – 2016 Percent Change | |||
| Number of Firms | Number of Jobs | Average Wage | Employment | Average Wage | |
| Total, All Industries | 412 | 4,524 | $38,896 | -15.4% | 12.1% |
| Education and Health Services | 52 | 967 | $39,936 | -17.9% | 33.3% |
| Trade, Transportation and Utilities | 118 | 960 | $26,156 | 3.4% | 12.8% |
| Manufacturing | 14 | 721 | $70,512 | -33.7% | 32.6% |
| Leisure and Hospitality | 55 | 640 | $16,640 | -4.9% | 24.0% |
| Source: DEED Quarterly Census of Employment and Wages | |||||
6Just Google it!
7Koochiching County