by Dave Senf
October 2014
Note: All data except for Minnesota’s PMI have been seasonally adjusted. See the feature article in the Minnesota Employment Review, May 2010, for more information on the Minnesota Index.
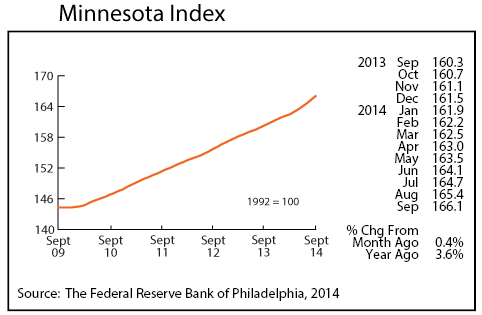
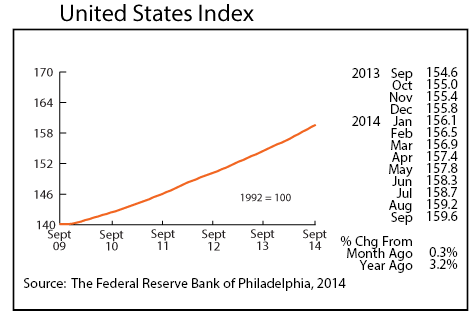
The Minnesota Index increased 0.4 percent for the fourth consecutive month in September, indicating that Minnesota’s economy has shifted into high gear. The index hasn’t been this high for as many consecutive months since late 1999 into early 2000. Job growth was strong for the second month in a row, and the unemployment rate declined by 0.2 points for the second straight month. The only negative: Average weekly manufacturing hours tailed off. The pace of economic growth has doubled since earlier in the year, and if the current pace continues through the rest of 2014, Minnesota’s GDP will top 3 percent for the first time since 2010.
Minnesota’s index in September was up 3.6 percent from a year ago compared to the U.S. index, which was 3.2 percent higher than a year ago. The last time Minnesota’s index was 3.6 percent higher over the year was August 2000. Minnesota’s index has been outpacing the U.S. index over the last three months. Both indices are real-time monthly proxies for GDP growth and are subject to significant revisions as preliminary data are revised.
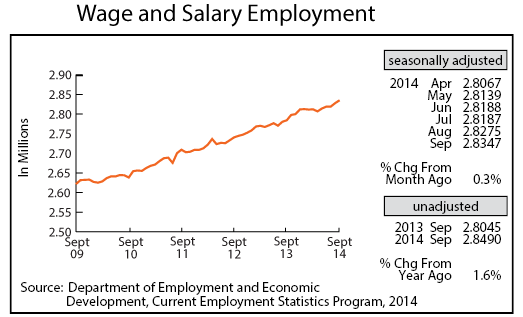
Adjusted Wage and Salary Employment climbed strongly for the second straight month with 7,200 jobs added in September to go with the revised 8,800 jobs added in August. The combined two-month gain is the largest two-month gain since last October and November. The uptick in hiring over the last two months is a welcome development as job growth was weak during the first half of the year. All of the job growth was in the private sector which added 11,400 jobs; the public sector cut 4,100 jobs. September’s private sector job jump was the 10th highest monthly gain over the last 24 years. Professional and Business Services added the most jobs with solid job additions also in Leisure and Hospitality, Other Services, Educational and Health Services, and Manufacturing.
Minnesota job growth over the year, using unadjusted job numbers, slipped to 1.6 percent, well below the 2.0 percent annual increase recorded nationally. Minnesota’s average over-the-year gain through September, however, is 1.8 percent as is the national average.
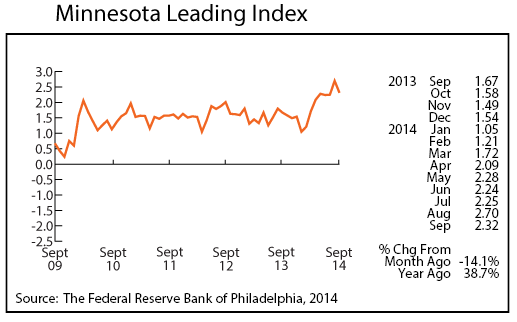
The Minnesota Leading Index dropped in September but remains elevated by historical standards. The index hasn’t been this strong since the last half of 1999. The index, which predicts Minnesota’s GDP expansion six months out, is signaling that the state’s economy will be growing at a 4 percent annual rate through next March. Minnesota’s leading index has been running substantially higher than the U.S. index since April. The index, however, gets revised as updated data come in, so expectations should be held in check.
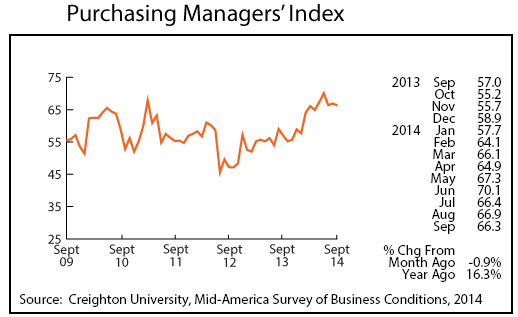
Minnesota’s Purchasing Managers’ Index (PMI) inched down to a still very solid 66.3 in September. Minnesota’s PMI has been above 60 for eight straight months. That is the longest streak of consecutive months of 60-plus, beating out a seven-month, 60-plus span during the first half of 2010. Manufacturing employment is up by more than 3 percent over the last three months which is the best over-the-year growth since early 2011.
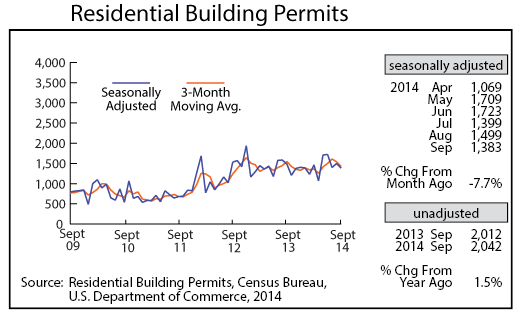
After plunging in July, adjusted Residential Building Permits zigzagged down in September, adding to this year’s disappointing home-building market. Home building has not been as strong as expected despite the continual improvement in the state’s economy.
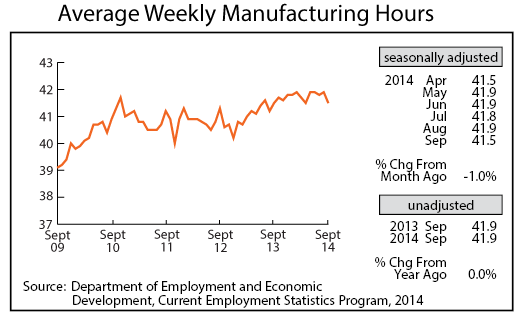
Adjusted Manufacturing Hours fell to 41.5 hours in September which was the shortest workweek since April. Despite the decline, the factory workweek remains high and, if there is no further decline, 2014’s annual average weekly manufacturing hours will finish among the highest on record.
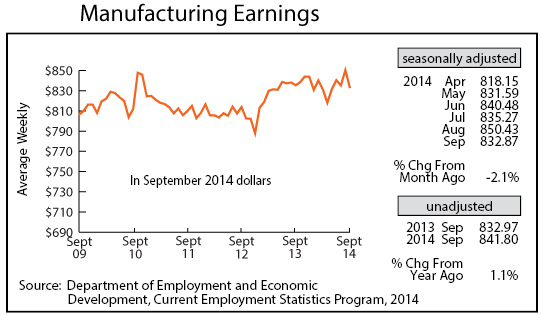
Manufacturing Earnings slipped from the second-highest total in August to $832.87 in September. Factory paychecks are still on pace to be 1.3 percent higher, roughly $550, in real terms for 2014 than 2013.
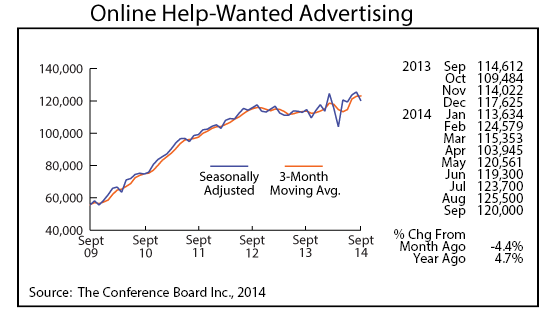
Minnesota’s adjusted online Help-Wanted Ads lost ground in September, slipping 4.4 percent. However, September’s 120,000 ads are the fourth highest on record, suggesting that labor demand remains strong by this measure. Online help-wanted ads also dipped nationally, falling by 2.6 percent. The state’s share of online job advertising was 2.4 percent in September, well above the state’s 2.0 percent share of the nation’s wage and salary employment.
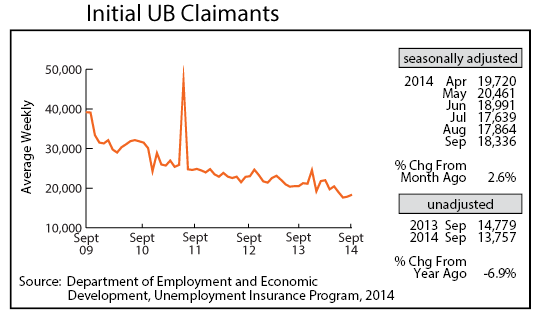
Adjusted Initial Claims for Unemployment Benefits (UB) rose for the second straight month in September but were down 6.9 percent from a year ago (unadjusted basis). Layoff levels remain low, suggesting that job growth will remain steady through the rest of the year.