by Dave Senf
March 2021
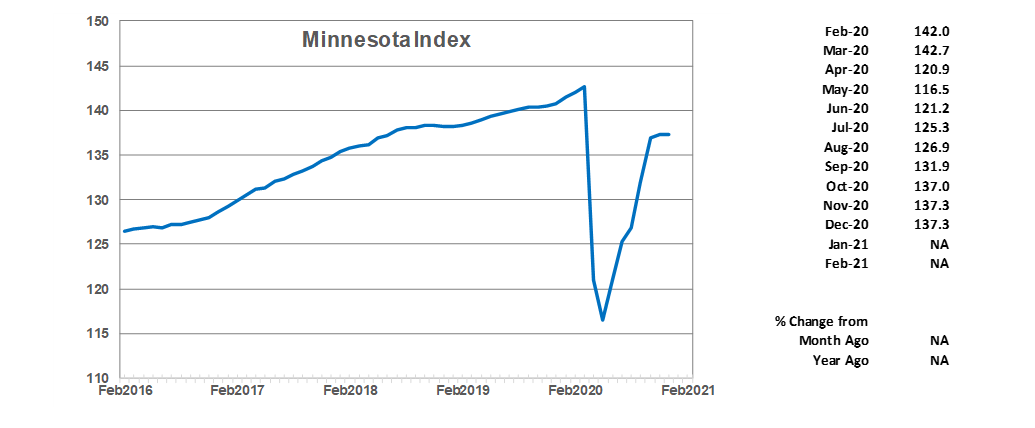
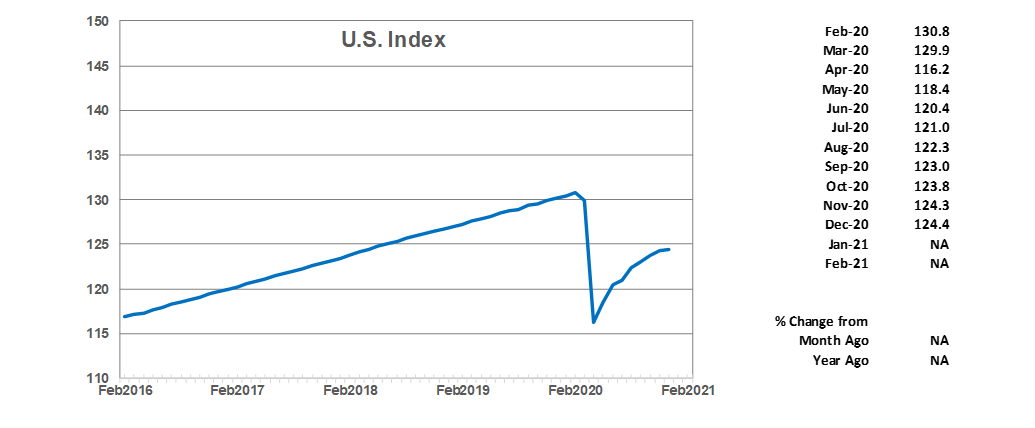
The Minnesota Index and U.S. Index are generated by the Philadelphia Federal Reserve Bank. At the beginning of each year the indices are delayed by two months as revised component numbers are used to recalibrate the indices. February's indices, as well as revisions to past indices were made available on April 9.
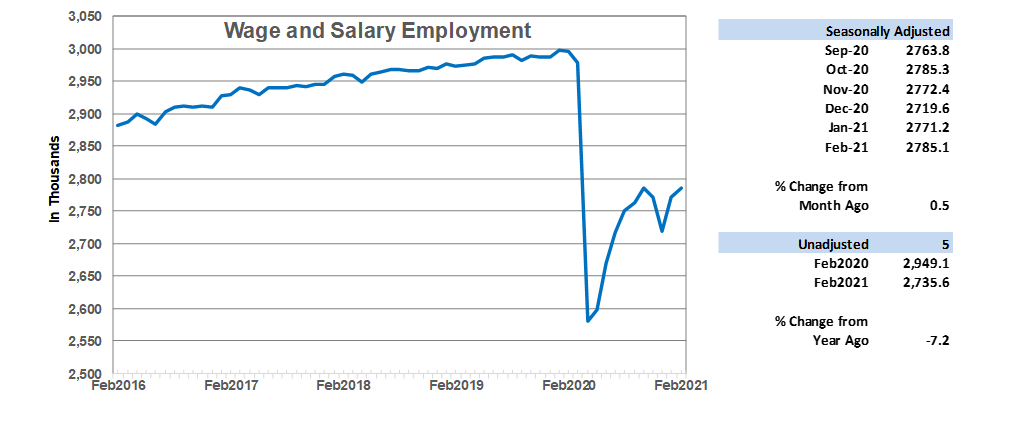
Wage and Salary Employment climbed for the second straight month in February, but the monthly gain was relatively small as cold weather during the month may have hampered economic activity. After adding 51,600 in January, Minnesota's employers added 13,900 jobs in February. The 0.5% increase was ahead of the 0.3% national increase. Over the first two months of the year, Minnesota's employment has increase 2.4% compared to the U.S. 0.4%. Reduced business restrictions in the state are mainly behind the state's strong relative job growth. February's job gain translates into Minnesota's having recovered roughly 49% of the 418,000 jobs lost in March and April as of February 2021. Nationally 58% of the 22.3 million jobs lost across the nation last March and April have been recovered as of February.
Most of the employment increase in February occurred in Leisure and Hospitality which added 13,500 jobs as bar and restaurant workers continued to return to the workforce. Government, Education and Health Services and Trade, Transportation, and Utilities also picked up hiring. Construction, Other Services, and Manufacturing reduced their payrolls as cold weather may have restricted work in these sectors.
Minnesota's unadjusted job total was 7.2% or 214,000 below last February's total. Unadjusted employment nationwide was 6.0% below 12 months ago or 9.1 million jobs.
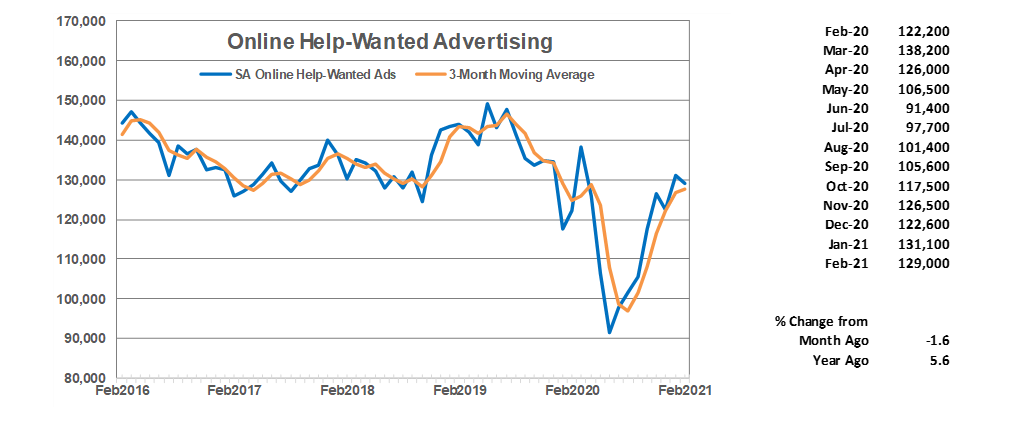
Online Help-Wanted Ads slipped in February to 129,000, a 1.6% decline. Online job posting dropped 7.0% across the nation, suggesting that February's dip in job postings was caused the cold snap experienced in mid-February. Online help-wanted ads in the state are up 5.6% from last February but remain below the 140,000 monthly average recorded in 2019. Minnesota's share of U.S. online job postings rose to 2.3% in February which was just a tad above the 2.2% share for all of 2020 but substantially below the 2.7% share in 2019.
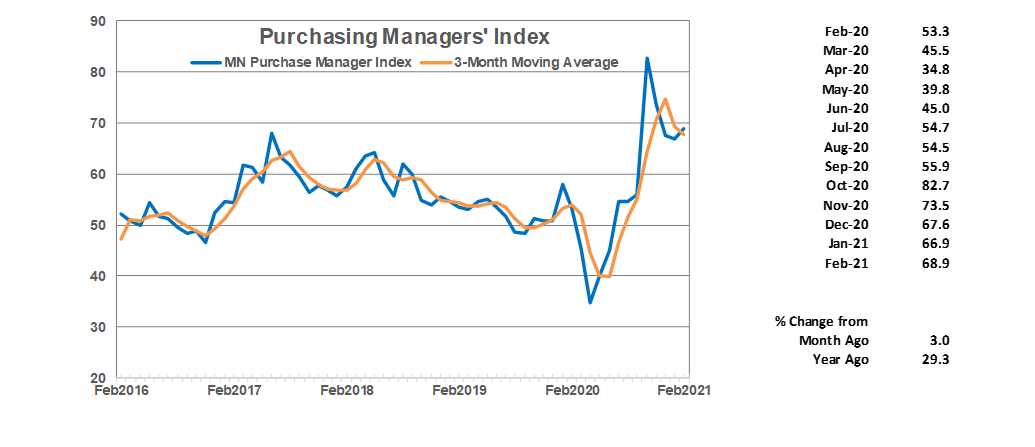
Minnesota's Purchasing Managers' Index (PMI) recorded a small bounce in February, inching up to 68.9. The PMI continues elevated, however, as the index is running far above the 26-year average for the index of 54.1. The PMI index hints at the direction of manufacturing activity trends. A reading above (below) indicates that Minnesota manufacturers expect manufacturing activity to expand (contract) over the next few months. The recent high readings suggest that Minnesota's manufacturers expect their firms to continue to rebound sharply from the pandemic related decline last year.
The national ISM Manufacturing Index and the Mid-America Business Index (nine states including Minnesota) also climbed in February. The national index jumped to 60.8 while the Mid-America index rose to 69.6.
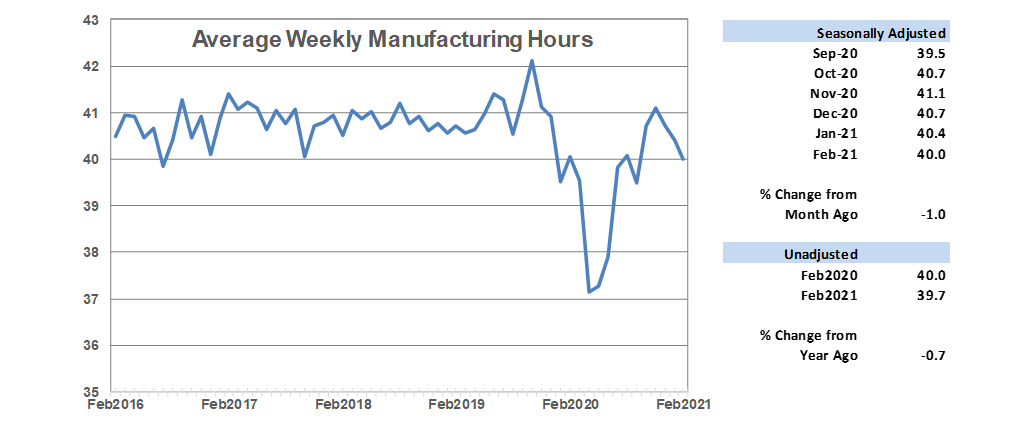
Average weekly Manufacturing Hours tailed off for the third consecutive month in February to 40.0 hours. February's drop off maybe related to the month's cold weather, but the three-month downward trend is inconsistent with manufacturing activity rebounding swiftly. Factories have added 2,100 jobs over the last six months but are down 16,500 jobs or 5.1% from last February. Manufacturing hiring usually picks up when factory hours rise as firms turn to hiring to expand production. Minnesota's manufacturing job rebound continues to lag the national rebound as U.S. factory employment was down 4.3% from a year ago in February.
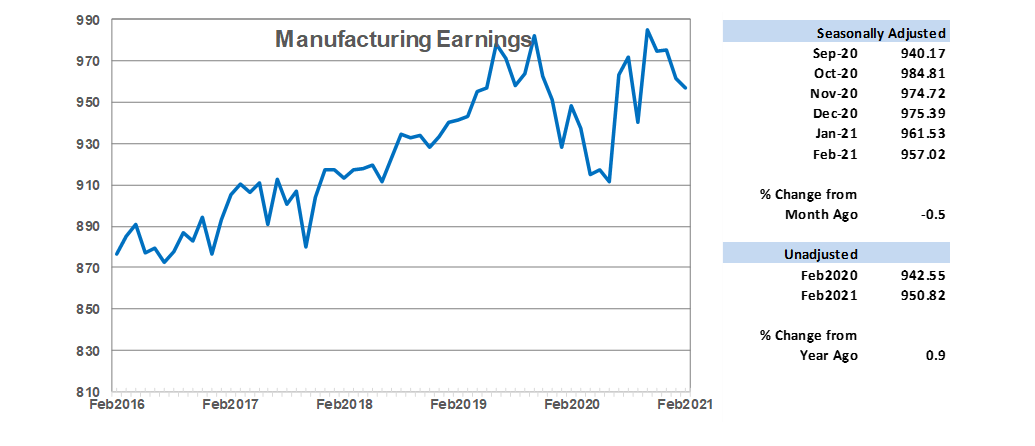
Average weekly Manufacturing Earnings, adjusted for inflation, inched down for the second month in a row to $957.02. Shrinking factory paychecks are consistent with declining factory hours but not with claims of an accelerating manufacturing recovery and increased problems with finding workers to fill openings.
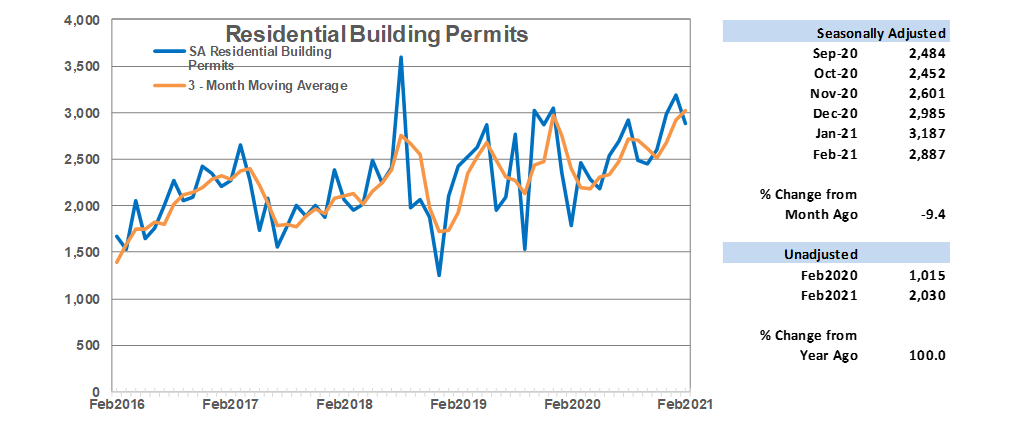
Adjusted Residential Building Permits, a proxy for future home building construction, retreated in February to 2,887 but remain robust as home prices continue to rise partly from shrinking home inventory as demand for housing remains elevated. The supply of previously owned homes remains near the record low, suggesting that demand for new home construction will remain strong in 2021. Permit levels during the first two months of the year were up 68% from last year, pointing towards this year a banner year for home building in the state.
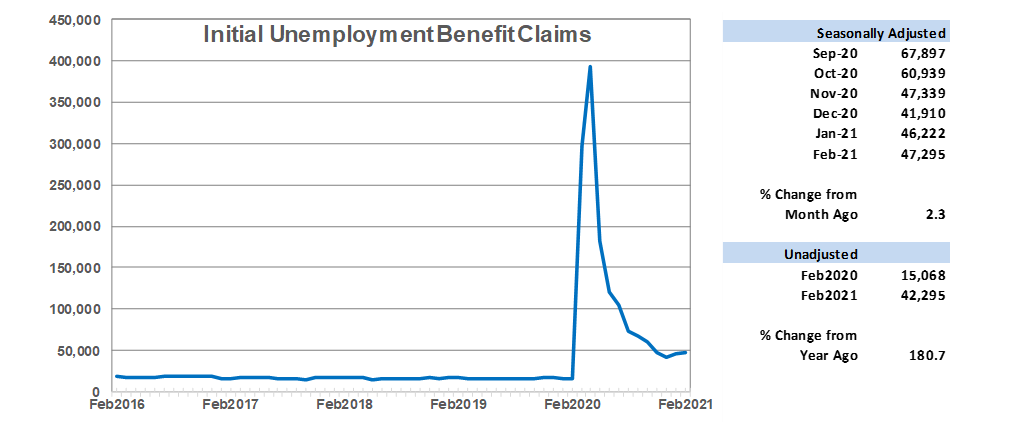
Adjusted Initial Claims for Unemployment Benefits (UB) inched up in February as initial claims rose for the second straight months after eight consecutive months of decline beginning in May. Unadjusted first claims for jobless benefits in February were 2.8 times higher than a year ago, a clear sign that the labor market remains far from normal. Despite the recent uptick in initial claims the labor market is expected to improve as vaccine distribution rates climb. Initial claims are expected to resume tailing off over the coming months as the job market heats up.
Note: All data except for Minnesota's PMI have been seasonally adjusted. See the feature article in the Minnesota Employment Review, June 2010, for more information on the Minnesota Index.
1The Philadelphia Federal Reserve Bank, which produces the Minnesota Leading Index, has temporary suspended generation of state leading indices.