by Cameron Macht
July 2013
According to its industry classification "the Chemical Manufacturing subsector is based on the transformation of organic and inorganic raw materials by a chemical process and the formulation of products.1 According to industry employment statistics from DEED's Quarterly Census of Employment and Wages (QCEW) program, the Chemical Manufacturing sector has transformed into a stable component of the state's economy, formulating significant earnings for its workers.
Through 2012 the Chemical Manufacturing sector provided 10,095 high-paying jobs at 279 business establishments in the state of Minnesota with a total payroll topping $762 million. The largest subsector is Pharmaceutical and Medicine Manufacturing, with 3,431 jobs at 52 manufacturers, followed by Soap, Cleaning Compound, and Toilet Preparations, Other Chemical Product and Preparations, Paint, Coating, and Adhesives, and Basic Chemical Manufacturing, each of which reported between 1,264 and 1,857 jobs in the last year (Table 1).
| Minnesota Chemical Manufacturing Employment, 2012 | |||||
|---|---|---|---|---|---|
| NAICS Industry Title | NAICS Code | 2012 Annual Average Data | |||
| Number of Business Establishments | Number of Covered Jobs | Total Industry Payroll | Average Annual Wages | ||
| Total, All Industries | 0 | 168,334 | 2,644,895 | $130,505,921,144 | $49,348 |
| Manufacturing Industry | 31 | 8,195 | 305,555 | $17,949,798,391 | $58,760 |
| Chemical Manufacturing Sector | 325 | 279 | 10,095 | $762,080,227 | $75,452 |
| Basic Chemical Manufacturing | 3251 | 47 | 1,264 | $82,622,655 | $65,364 |
| Resin, Synthetic Rubber, Artificial Fibers and Filaments Manufacturing. | 3252 | 9 | 378 | $27,532,155 | $72,748 |
| Pesticide, Fertilizer, and Other Agricultural Chemical Manufacturing. | 3253 | 21 | 114 | $6,852,362 | $60,528 |
| Pharmaceutical and Medicine Manufacturing | 3254 | 52 | 3,431 | $253,747,313 | $73,892 |
| Paint, Coating, and Adhesive Manufacturing | 3255 | 30 | 1,382 | $173,613,358 | $125,736 |
| Soap, Cleaning Compound, and Toilet Preparation Manufacturing. | 3256 | 52 | 1,857 | $104,953,332 | $56,524 |
| Other Chemical Product and Preparation Manufacturing | 3259 | 69 | 1,668 | $112,759,052 | $67,600 |
| Source: DEED Quarterly Census of Employment and Wages (QCEW) program | |||||
Weighing in at just over $75,000 in 2012, average annual wages were about $25,000 higher in the Chemical Manufacturing Sector than in the total of all industries and about $17,000 higher than the Manufacturing industry. The highest paying subsector is the Paint, Coating, and Adhesive Manufacturing sector where average annual wages topped $125,000 in 2012, while the lowest paying subsector was Soap and Cleaning Compound Manufacturing which at $56,524 was still $7,000 higher than the total of all industries.
In addition to direct employment, there are another 638 firms and 5,752 jobs involved in the Wholesale Trade of Chemical Products, including Drugs and Druggists' Sundries Merchant Wholesalers, which has 192 firms and 2,274 jobs, 273 firms and 1,795 jobs at Chemical and Allied Products Merchant Wholesalers, and 173 firms and 1,683 jobs at Petroleum and Petroleum Products Merchant Wholesalers. Average annual wages for these wholesale trade specialties was even higher, at $83,372 in 2012, including $112,944 at Drugs and Druggists' Sundries Merchant Wholesalers.
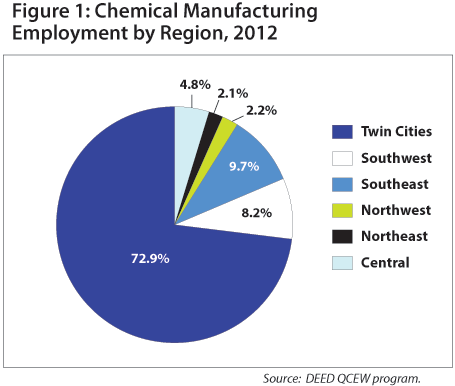
Sixty percent of the state's Chemical Manufacturing firms and 72.9 percent of the state's jobs are located in the seven-county Twin Cities metropolitan area, with the remainder spread across Greater Minnesota. Both Southeast and Southwest Minnesota had just under 10 percent of the Chemical Manufacturing employment, while Central had about 5 percent and Northeast and Northwest both had just over 2 percent (Figure 1).

The Twin Cities had 98 percent of the state's Paint, Coating, and Adhesive Manufacturing jobs, 88 percent of the jobs in the Soap and Cleaning Compound Manufacturing subsector, and 85 percent of the state's Pharmaceutical and Medicine Manufacturing jobs, with the latter supplemented by small concentrations in Central, Southwest, and Northwest Minnesota. Only about one-fourth of the state's Basic Chemical Manufacturing jobs and around half of the jobs in the other three subsectors were in the Twin Cities. Instead, Southwest Minnesota, which is home to most of the state's ethanol and biodiesel plants, accounted for 43.6 percent of the state's Basic Chemical Manufacturing jobs. Southeast Minnesota provided more than 30 percent of the state's employment in the Other Chemical Product and Preparation Manufacturing subsector.
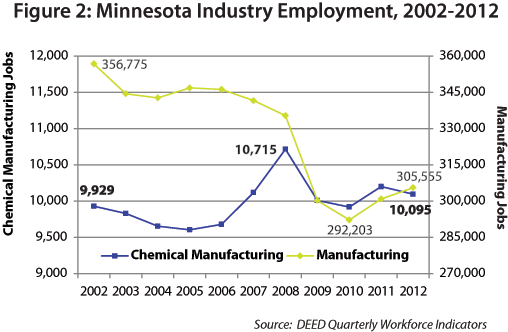
Over the last decade the Chemical Manufacturing sector has been relatively stable, actually gaining 166 jobs from 2002 to 2012, while the Manufacturing industry as a whole lost more than 50,000 jobs. After seeing small but steady employment declines from 2002 to 2006, Chemical Manufacturing ramped up quickly in 2007 and peaked in employment in 2008 with 10,715 jobs.
But the Manufacturing industry was hit especially hard during the recession, falling from 341,588 jobs in 2007 to 292,203 jobs in 2010, a loss of 49,385 jobs for a 14.5 percent decline. In contrast, the Chemical Manufacturing sector lost just 200 jobs from 2007 to 2010, a 2.0 percent decline. Then in the last two years, Manufacturing has regained more than 13,350 jobs, a 4.6 percent increase. The increase was helped by 177 net new jobs in Chemical Manufacturing, a 1.8 percent expansion (Figure 2).

Job changes were much more volatile in the various regions, ranging from a 27.7 percent employment decline in Northwest Minnesota over the last decade to a 151.8 percent expansion in Central Minnesota. Southwest Minnesota also saw a big gain in Chemical Manufacturing jobs from 2002 to 2012, although it suffered a small drop in the last two years. Southeast Minnesota lost jobs through 2010, then enjoyed a post-recession resurgence that gave it a net gain for the entire 10-year period. Employment in the Twin Cities declined slowly but steadily from 2002 to 2012 (Table 2).
| Chemical Manufacturing Employment by Region, 2002-2012 | |||||
|---|---|---|---|---|---|
| Change in Jobs | |||||
| Region | 2002 Jobs | 2010 Jobs | 2012
Jobs |
2002-2012 | 2010-2012 |
| Central | 193 | 268 | 486 | +151.8% | +81.3% |
| Northeast | 232 | 224 | 209 | -9.9% | -6.7% |
| Northwest | 300 | 189 | 217 | -27.7% | +14.8% |
| Southeast | 897 | 833 | 977 | +8.9% | +17.3% |
| Southwest | 538 | 849 | 827 | +53.7% | -2.6% |
| Twin Cities | 7,756 | 7,465 | 7,318 | -5.6% | -2.0% |
| Source: DEED QCEW program | |||||
According to data from DEED's Quarterly Workforce Indicators, the mix of workers in the Chemical Manufacturing sector are more likely to be male, between 25 and 54 years of age, and college educated than workers in other industries. About two-thirds (63.6%) of the Chemical Manufacturing workforce was male, though that was 7 percent less than the Manufacturing industry as a whole (70.7%). The total of all industries is split more evenly between males (49.0%) and females (51.0%).
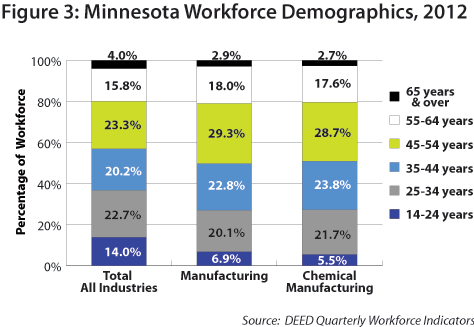
Almost three-fourths (74.2%) of the Chemical Manufacturing workforce was in their prime working years, from 25 to 54, compared to just two-thirds (66.2%) of the total workforce. Likewise, the largest component - 28.7 percent - was 45 to 54 years of age, which was 5 percent higher than the total of all industries.
About 20 percent of the workforce in both Chemical Manufacturing and the total of all industries were 55 years and over, although less than 3 percent were over 65 years. In contrast, only 5.5 percent of the Chemical Manufacturing workforce was under 25 years of age, compared to 14 percent of the total of all industries (Figure 3).

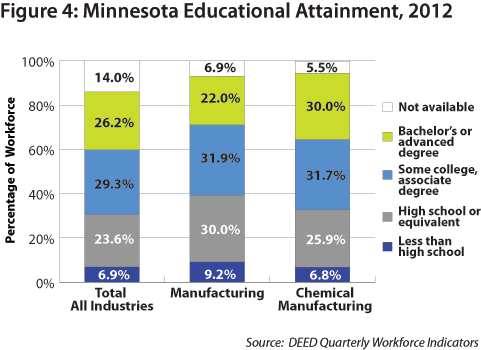
As noted, workers in the Chemical Manufacturing sector were more likely to be college educated than workers in other industries. Thirty percent of workers had bachelor's or advanced degrees, which was 4 percent higher than the total of all industries and 8 percent higher than the Manufacturing industry as a whole. Likewise, almost one-third (31.7%) of Chemical Manufacturing jobs were held by workers who had some college or an associate degree, which was about 2.5 percent higher than the total of all industries. The remaining one-third of workers had a high school diploma or less, which was 6.5 percent lower than Manufacturing but in line with the total of all industries (Figure 4).

Data show that job seekers looking to get into the high-paying Chemical Manufacturing sector will likely need some education or training beyond high school. Of the top 20 jobs in the sector, only one - packers and packagers - does not require at least a high school diploma, and it was easily the lowest paying job. In contrast, several of the larger and faster growing occupations require an associate degree, bachelor's degree, or advanced degree, and pay significantly higher wages in return (Table 3).
| Chemical Manufacturing Occupations in Demand | |||||||
|---|---|---|---|---|---|---|---|
| Title | Median Hourly Wage | Estimated Employment 2010 | Projected Employment 2020 | Percent Change 2010 - 2020 | New Jobs Created 2010 - 2020 | Replacement Openings 2010 - 2020 | Education and Training Requirements |
| Industrial Production Managers | $43.95 | 4,619 | 5,275 | +14.2% | 656 | 1,090 | Bachelor's degree |
| Natural Sciences Managers | $51.66 | 1,332 | 1,446 | +8.6% | 114 | 800 | Bachelor's degree |
| General and Operations Managers | $42.16 | 30,604 | 31,524 | +3.0% | 920 | 5,690 | Associate degree |
| Business Operations Specialists | $28.47 | 44,157 | 48,715 | +10.3% | 4,558 | 8,470 | Long-term on-the-job training |
| Biochemists and Biophysicists | $31.32 | 321 | 441 | +37.4% | 120 | 70 | Advanced degree |
| Medical Scientists, ex. Epidemiologists | $27.14 | 1,739 | 2,292 | +31.8% | 553 | 110 | Advanced degree |
| Chemists | $45.19 | 1,446 | 1,556 | +7.6% | 110 | 470 | Bachelor's degree |
| Biological Technicians | $22.24 | 1,255 | 1,428 | +13.8% | 173 | 420 | Bachelor's degree |
| Chemical Technicians | $22.64 | 469 | 508 | +8.3% | 39 | 70 | Associate degree |
| Industrial Machinery Mechanics | $23.53 | 6,478 | 8,012 | +23.7% | 1,534 | 1,240 | Long-term on-the-job training |
| General Maintenance and Repair Workers | $19.13 | 17,999 | 19,815 | +10.1% | 1,816 | 3,310 | Moderate on-the-job training |
| First-Line Supervisors of Production Workers | $26.30 | 13,283 | 14,088 | +6.1% | 805 | 1,740 | Post-secondary non-degree award |
| Team Assemblers | $15.13 | 18,357 | 20,299 | +10.6% | 1,942 | 3,640 | Moderate on-the-job training |
| Chemical Plant and System Operators | $18.49 | 93 | 106 | +14.0% | 13 | 30 | Long-term on-the-job training |
| Chemical Equipment Operators | $21.11 | 415 | 412 | -0.7% | -3 | 70 | Moderate on-the-job training |
| Mixing and Blending Machine Operators | $19.10 | 2,031 | 2,019 | -0.6% | -12 | 610 | Moderate on-the-job training |
| Inspectors, Testers, Sorters and Samplers | $17.57 | 6,978 | 7,693 | +10.2% | 715 | 1,520 | Moderate on-the-job training |
| Packaging and Filling Machine Operators | $14.02 | 9,078 | 9,439 | +4.0% | 361 | 1,500 | Moderate on-the-job training |
| Heavy and Tractor-Trailer Truck Drivers | $19.45 | 34,281 | 42,055 | +22.7% | 7,774 | 6,820 | Short-term on-the-job training |
| Packers and Packagers, Hand | $9.67 | 12,851 | 13,783 | +7.3% | 932 | 3,680 | Short-term on-the-job training |
| Source: DEED Occupational Employment and Wage Statistics, 2010-2020 Employment Outlook tool | |||||||
According to DEED's 2010 to 2020 Employment Projections, some occupations are expected to see fast growth - including biochemists and biophysicists, medical scientists, industrial production managers, industrial machinery mechanics, chemical plant and system operators, and biological technicians - while others may see declines or slower, more stable change - such as chemical equipment operators, natural science managers, chemists, and chemical technicians.
In fact, most of the occupations in demand in Chemical Manufacturing will have more replacement openings - an estimate of the need for new workforce entrants to replace workers who will retire or otherwise leave the occupation permanently - than new jobs created. For example, the largest occupation in the sector, mixing and blending machine operators, is expected to see a decline in the number of jobs, but will still need 610 new workers to fill jobs that become open through retirements or resignations.
Much like the last decade, the Chemical Manufacturing sector is projected to remain stable in the future, though some of the subsectors and regions may again be more volatile. In fact, only two of the seven subsectors are expected to see employment growth over the next decade, with huge job jumps forecasted in Pharmaceutical and Medicine Manufacturing and Basic Chemical Manufacturing. The other five subsectors are projected to decline, with Other Chemical Preparation Manufacturing potentially suffering the biggest job loss (Table 4).
| Minnesota Chemical Manufacturing Employment Projections, 2010 to 2020 | ||||||||||
|---|---|---|---|---|---|---|---|---|---|---|
| NAICS Industry Title | State of Minnesota | Minnesota Planning Regions | ||||||||
| 2010 Estimated Jobs | 2020 Projected Jobs | 2010-2020 Percent Growth | 2010-2020 Numeric Growth | Central | Northeast | Northwest | Southeast | Southwest | Twin Cities | |
| Total, All Industries | 2,830,000 | 3,198,000 | +13.0% | +368,000 | +18.3% | +13.1% | +14.4% | +14.3% | +10.4% | +12.0% |
| Manufacturing | 292,082 | 306,280 | +4.9% | +14,198 | +11.6% | +8.5% | +16.6% | +3.8% | +7.1% | +1.0% |
| Chemical Manufacturing | 9,920 | 10,310 | +3.9% | +390 | +11.9% | -9.6% | -0.5% | -0.6% | +24.9% | +2.3% |
| Basic Chemical Manufacturing | 1,210 | 1,400 | +15.7% | +190 | ND | ND | 0.0% | +53.9% | +37.1% | -24.6% |
| Resin, Rubber, and Artificial Fibers Mfg. | 345 | 340 | -1.4% | -5 | ND | ND | ND | ND | ND | +8.2% |
| Pesticide and Other Agri. Chemical Mfg. | 122 | 80 | -34.4% | -42 | ND | ND | ND | ND | ND | -32.8% |
| Pharmaceutical and Medicine Mfg. | 3,478 | 4,400 | +26.5% | +922 | +26.5% | ND | +4.7% | ND | +39.6% | +26.5% |
| Paint, Coating, and Adhesive Mfg. | 1,265 | 1,100 | -13.0% | -165 | ND | +6.7% | ND | ND | ND | -13.5% |
| Soap and Cleaning Compound Mfg. | 1,604 | 1,500 | -6.5% | -104 | +25.0% | ND | ND | -8.5% | ND | -7.1% |
| Other Chemical Product and Prep. Mfg. | 1,896 | 1,490 | -21.4% | -406 | -40.5% | -12.4% | ND | -17.2% | -19.4% | -23.7% |
| Source: DEED 2010-2020 Employment Outlook tool | ||||||||||
The Twin Cities, Central, and Southwest Minnesota are expected to see job gains, while Northwest and Southeast Minnesota will likely hold steady. Northeast Minnesota is projected to lose almost 10 percent of its Chemical Manufacturing jobs. Different regions are expected to see different opportunities for job growth, though, such as a 53.9 percent increase in Basic Chemical Manufacturing in Southeast, nearly 40 percent gains in Basic Chemical and Pharmaceutical and Medicine Manufacturing in Southwest, 25 percent increases in Soap and Cleaning Compound Manufacturing and Pharmaceutical and Medicine Manufacturing in Central, and an identical 26.5 percent jump in Pharmaceutical and Medicine Manufacturing in the Twin Cities.
As opportunities in the Chemical Manufacturing sector continue to transform, job seekers can react by formulating a plan for a high-paying career.
1325 Chemical Manufacturing.