by Dave Senf
February 2020
Note: All data except for Minnesota’s PMI have been seasonally adjusted. See the feature article in the Minnesota Employment Review, May 2010, for more information on the Minnesota Index.
The Minnesota Index, U.S. Index, and Minnesota Leading Index are generated by the Philadelphia Federal Reserve Bank. At the beginning of each year the indices are delayed by two months as revised component numbers are used to recalibrate the indices. Updated coincident indices are scheduled for release on April 2 while leading indexes will be released April 4.
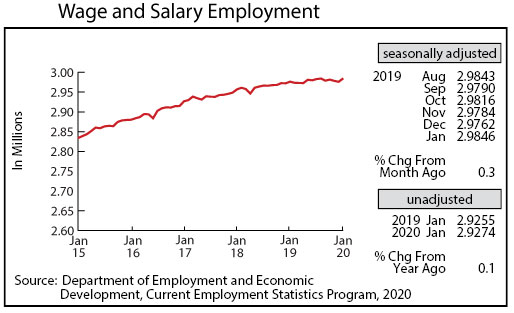
Minnesota’s adjusted Wage and Salary Employment got off to a good start in January, increasing 8,400. January’s gain was the largest monthly jump since May 2018. Revised employment numbers report that the state added 3,900 jobs between December 2018 and 2019. That is the lowest annual increase since 2009 when job growth was negative. The December 2019 job number will be revised again in March 2021, so the falloff in job growth may not be as steep as currently reported.
All of January’s job growth was in the private sector with employment rising by 8,500 while public sector employment dropped by 100. Most of the job growth occurred in the Professional and Business Services and the Trade, Transportation, and Utilities sector. Six supersectors added positions, and five cut positions. Most of the jobs lost were in Leisure and Hospitality.
Minnesota’s unadjusted over-the-year job growth in January was 0.1 percent which is an improvement over the negative 0.1 percent in December. Last year’s annual average job growth rate was revised up from 0.3 percent to 0.5 which is the lowest rate since 2010. Annual average job growth in 2018 was also revised up to 0.9 percent from 0.7 percent. The 0.5 percent annual average increase in 2019 translates into 14,300 jobs on an annual average basis. Annual average job growth in 2018 was 25,000 and 38,700 in 2017.
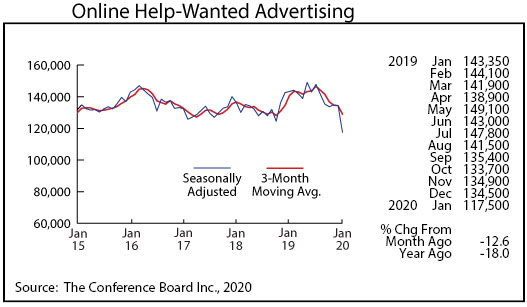
Online Help-Wanted Ads declined sharply in January to 117,500. Minnesota’s decline was 12.5 percent compare to a 6.1 percent increase nationwide. Minnesota’s share of U.S. online postings nosedived to 2.1 percent in January after having averaged 2.7 over the last four years. This is a sign that labor demand in the state may be weakening relative to other areas across the country. The 2.1 percent share of help-wanted ads is just above Minnesota’s 1.9 percent of U.S. wage and salary employment in January.
The newly released state-level JOLTS (Job Openings and Labor Turnover Survey), shows a similar trend. Minnesota’s job openings from JOLTS peaked in October 2018 and have fallen 20 percent through September 2019. Minnesota’s job openings from JOLTS averaged 2.2 percent of U.S. openings between 2015 and 2019 and was 1.9 percent as of September 2019.
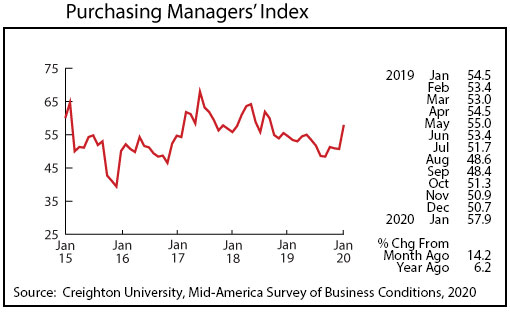
Minnesota’s Purchasing Managers’ Index (PMI)recorded its largest jump since June 2017, climbing to 57.9 and indicating that the Minnesota’s manufacturing firms may be gaining momentum. The Mid-America Business Index also rose to 57.2, but the national PMI dipped to 47.8.
Minnesota’s PMI averaged 52.1 over 2019 compared to 58.6 in 2018. Manufacturing employment in the state was up 0.6 percent in 2019 on an annual average basis which was down from the 1.1 percent increase in 2018. Minnesota’s manufacturing employment as of 2019 was down 5.2 percent from 2007 while U.S. manufacturing was 7.5 percent lower in 2019 than in 2007. Minnesota’s share of nationwide manufacturing climbed slightly between 2010 and 2016 but has slipped slightly over the last three years. Despite the uptick in January, Minnesota’s manufacturing activity is likely to remain restrained during the first half of 2020.
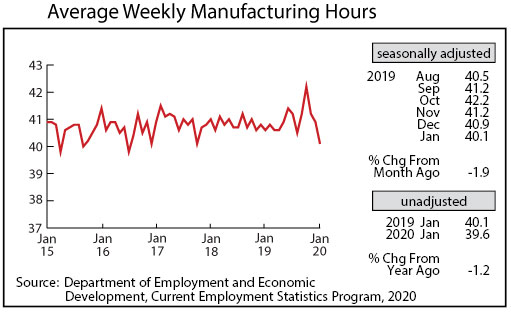
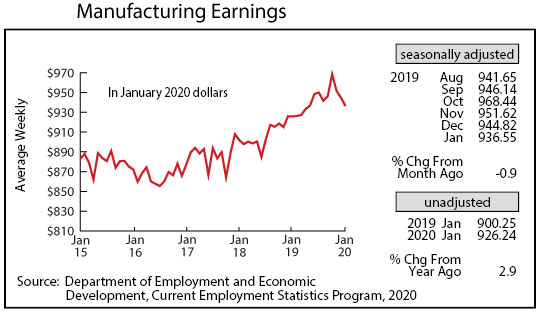
After spiking in October adjusted average weekly Manufacturing Hours have tumbled three months in a row. Factory hours tailed off in January to 40.1, the lowest reading since July 2016. Average weekly Manufacturing Earnings, adjusted for inflation and seasonality. have also slipped over the last three months, dipping to $936.55. That was up 1.2 percent in real terms from last January.
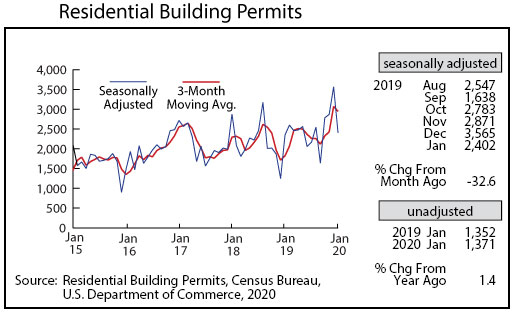
The adjusted Residential Building Permits level declined sharply in January to 2,402, but the decline was from a 14-year high recorded in December. Home-building permits have averaged roughly 2,100 over the last 50 years so January’s level was above average. Home-building permits were up on an unadjusted basis 2.2 percent from a year ago, indicating that residential building will continue to be solid at least for the first few months of 2020.
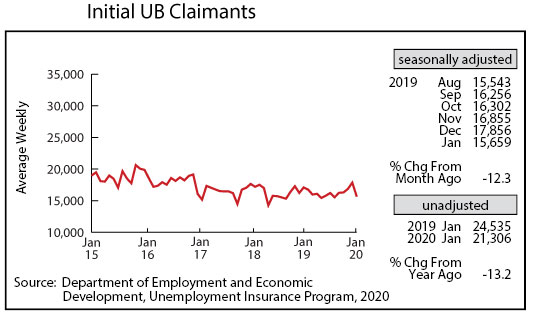
Adjusted Initial Claims for Unemployment Benefits (UB) dropped sharply in January after a gradual advanced over the previous four months. January’s 15,659 was the lowest monthly count since August 2018.
