by Dave Senf
September 2020
Note: All data except for Minnesota’s PMI have been seasonally adjusted. See the feature article in the Minnesota Employment Review, May 2010, for more information on the Minnesota Index.
The Philadelphia Federal Reserve Bank, which produces the Minnesota Leading Index, has temporarily suspended generation of state leading indices.
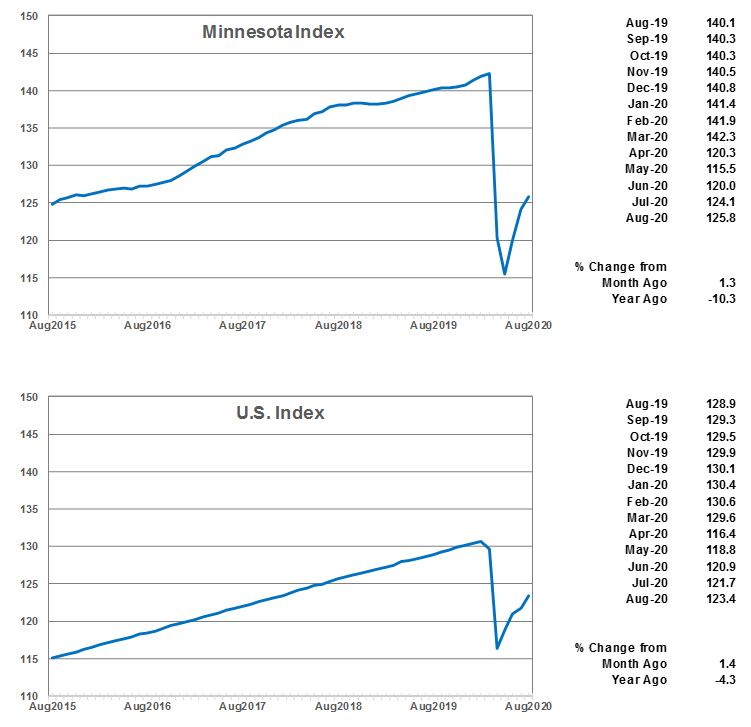
The Minnesota Index increased for the third consecutive month in August, advancing to 125.8. Minnesota’s index increased 1.3% from last month while the U.S. index rose 1.4%. All four components in Minnesota’s index improved in August but improvement in several of the components was weaker than in June or July. Wage and salary employment was stronger in August but the decline in unemployment was minimal (7.6 to 7.4%), and average weekly manufacturing hours only inched up. Minnesota’s unemployment rate hasn’t fallen as quickly as the national rate primarily because Minnesota’s labor force decline hasn’t been as steep as nationwide.
Minnesota’s index is down 10.3% from a year ago while the U.S. index is down 4.3% over the year. Minnesota index is still 11.6% lower than its peak in March. The U.S. index is 5.6% below its peak reached in February. Based on state coincident index, which is what the Minnesota Index is, Utah is the only state with an economy in August larger than before the pandemic hit. Idaho and Georgia’s economies are 0.6 and 0.7% below pre-pandemic size. The size of the economies in Hawaii and West Virginia in August were 29.7 and 27.2% smaller than pre-pandemic peak. Wisconsin’s economy was 6.9% below its pre-pandemic peak while Iowa was 9.9% smaller, South Dakota 13.6% lower, and North Dakota 14.2% smaller.
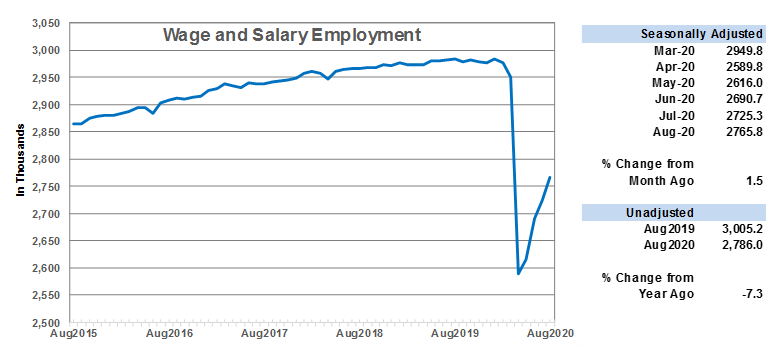
Adjusted Wage and Salary Employment continued to recover in August as Minnesota employers added 40,500 workers, topping the 34,600 added in July. In percentage terms, jobs in Minnesota increased 1.5% while nationally the increase was 1.0% in August. The state has recovered 45% of the 387,800 jobs lost in March and April since job growth resumed in May while the U.S. has recovered 48%. Minnesota lost 13.0% of its wage and salary employment during March and April compared to 14.5% for the U.S.
The private sector added 29,500 jobs in August while public sector payrolls expanded by 11,000. All sectors except Financial Activities expanded payrolls. Leisure and Hospitality, Educational and Health Services, and Manufacturing added the most positions. The 5,200 manufacturing jobs added in August was the largest monthly gain on record, but manufacturing employment is still 4.7% or 15,200 below February’s level. The Goods-producing sector has recovered 34.8% of jobs lost in March and April while the Service-providing sector has recovered 46.4%. The Goods-producing sector is 22,300 jobs below the pre-pandemic level while the Service-providing sector is 189,500 jobs below.
Minnesota’s unadjusted over-the-year employment was negative 7.3%, meaning that there were 7.3% fewer wage and salary jobs in August compared to a year ago. The U.S. decline was 7.0%. Idaho had the lowest over-the-year decline of 0.5% while Hawaii had the largest with 16.3% fewer jobs than 12 months ago. Minnesota’s 7.3% decline ranks as the 18th largest drop. Over-the-year percent declines in surrounding states were South Dakota (4.5%), Iowa (5.8%), North Dakota (6.8%), and Wisconsin (7.4%).
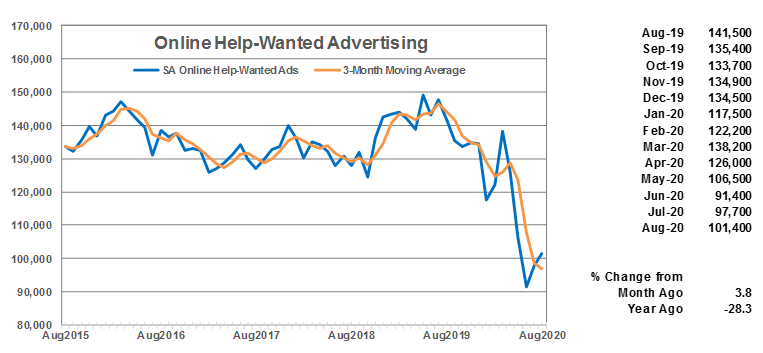
Online Help-Wanted Ads, after dropping from April to June, have now increased for two straight months. Minnesota online postings climbed to 101,400 in August, a gain of 3.8%. Online postings nationwide rose 5.3%. Online help-wanted ads in Minnesota in August were 19.5% below postings recorded in March compared to 16.4% lower nationwide for the same period.
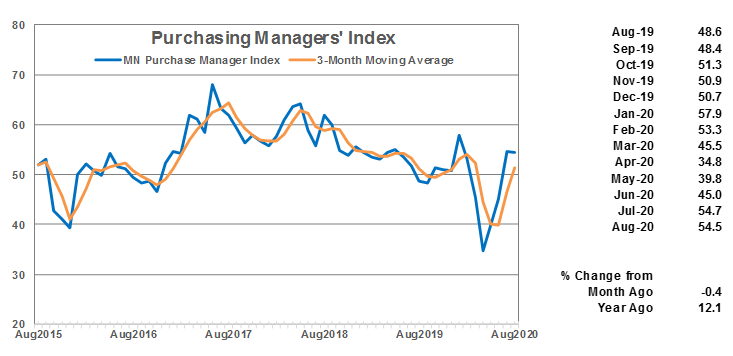
After climbing during the previous three months, Minnesota’s Purchasing Managers’ Index (PMI) inched down to 54.5 in August. Despite the record number of manufacturing jobs added in August, Minnesota’s PMI continued to trail the Mid-America Business Index (60.0) and the national PMI (56.0). The lower PMI reading for the state suggest that Minnesota’s manufacturing recovery over the next few months will continue to lag behind the factory rebound in most parts of the country.
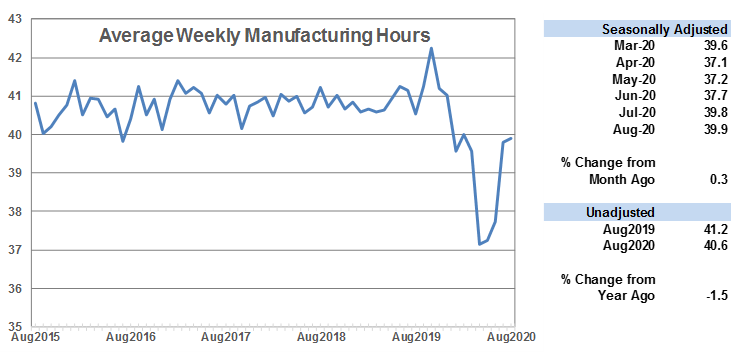
Average weekly Manufacturing Hours rose for the fourth straight month to 39.9 in August after having crashed in April to 37.1 hours. August’s reading is just below the 40.0 hours reported in February but significantly below the 41.0 hours annual average recorded in 2019.
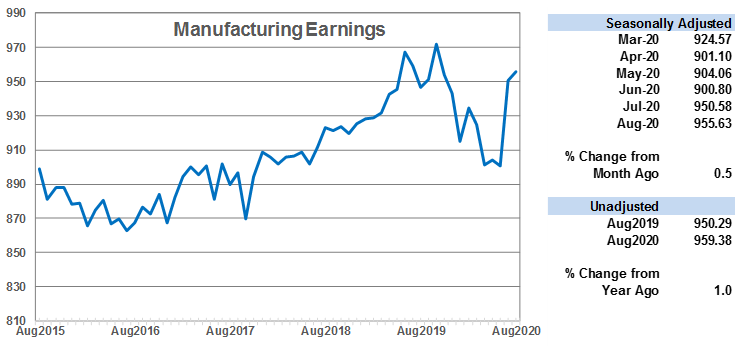
Average weekly Manufacturing Earnings continued to climb, reaching $955.63 in August. While manufacturing jobs have not recovered to pre-pandemic levels, factory paychecks have. August’s real factory paycheck was the fourth highest in the 50 years of the series. Manufacturing earnings are up 1.0% from a year ago after accounting for inflation.
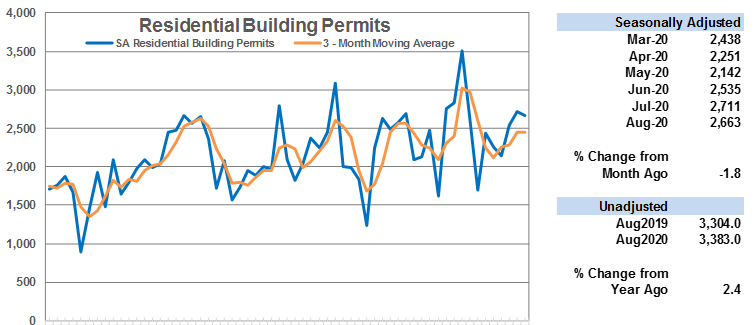
Adjusted Residential Building Permits dipped slightly in August to 2,663. Home building in Minnesota as well as nationally continues to be robust, fueled in part by near record-low mortgage rates. Minnesota home building permits accounted for 2.7% of U.S. permits in August and 2.0% through the first eight months of the year. Total unadjusted permits issued through the first eight months of 2020 are almost the same as a year ago. In 2019, 18,800 unadjusted home building permits were issued through August which is just a tad above this year’s total of 18,700.
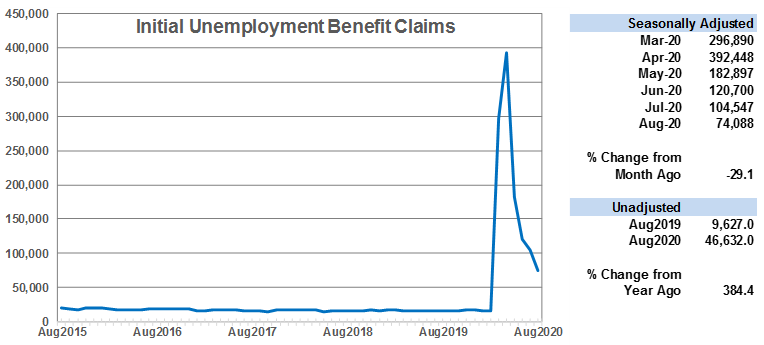
Adjusted Initial Claims for Unemployment Benefits (UB) continued to drop in August, falling to 74,088. The decline in August was larger in percentage terms than in July, but the level of claims remains at historical highs. The 50-year monthly average claim level (pre-pandemic) is roughly 21,000. August’s level is more than 3.5 times higher than the historical average. Employers who may have held on to workers over the last few months are now reducing their payroll numbers as the initial demand shock of the pandemic continues to ripple through the economy.
The Philadelphia Federal Reserve Bank, which produces the Minnesota Leading Index, has temporary suspended generation of state leading indices.