
by Dave Senf
December 2017
Workers are taking home higher paychecks, thanks to a tighter labor market.
By all indicators, Minnesota's labor market continued to tighten in 2017. The state's annual unemployment rate looks to be headed toward 3.8 percent, joining 2015 and 2016 on the list of the 10 lowest annual jobless rates (see Table 1).1 Minnesota's U-6 unemployment rate – the broadest unemployment rate that includes underemployed and discouraged workers – dropped to 6.8 percent in October, the lowest rate in 16 years.2
| Year | Unemployment Rate | Labor Force Participation Rate |
|---|---|---|
| 1998 | 2.7 | 74.8 |
| 1999 | 2.8 | 74.9 |
| 2000 | 3.1 | 75.4 |
| 1997 | 3.3 | 74.7 |
| 1995 | 3.7 | 74.7 |
| 2015 | 3.8 | 69.4 |
| 2001 | 3.8 | 75.3 |
| *2017 | 3.8 | 69.8 |
| 2016 | 3.9 | 69.6 |
| 1996 | 3.9 | 75.0 |
| 1978 | 3.9 | 67.8 |
| *Through the first 10 months of the year | ||
Job vacancies reached a record high in the second quarter, with the number of job openings exceeding the number of unemployed workers for the first time since the second quarter of 2001.3 Even the labor force participation rate, which had been declining since 2000, has reversed direction, inching up over the last few years despite the growing number of retired Minnesotans. The tight labor market might be convincing some people, previously on the job sideline, to rejoin the labor force.
The ultimate indicator of a tight job market – rising wages – was hard to find earlier in the recovery, but it has emerged in Minnesota over the last few years. Wage growth has accelerated in the tighter Minnesota labor market, giving workers bargaining power for pay increases or giving them opportunities to switch to jobs offering fatter paychecks.
Average weekly wages as measured by the Quarterly Census of Employment and Wages has been on a steady upswing for four years, including the first half of 2017.4 Real (inflation-adjusted) average wages rose 7.2 percent between the second quarters of 2013 and 2017, compared with 2.6 percent over the previous 10 years, which included a period of declining wages during the recession (see Chart 1).5
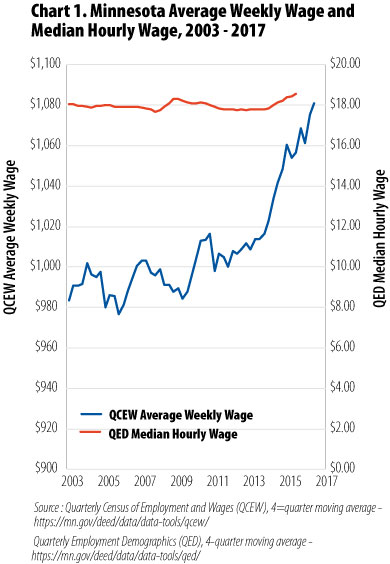
Workers at the top of the pay scale have not enjoyed the faster pace of wage growth, as evidenced by a jump in the Quarterly Employment Demographics median hourly wage rate. The median wage (half of all workers make more, half make less) actually lost ground from 2003 to 2014, declining by 1.1 percent. But it rose 4.1 percent between 2014 and 2016. (Median wage data are available only through the second quarter of 2016, while average wage data are available through the second quarter of 2017.)
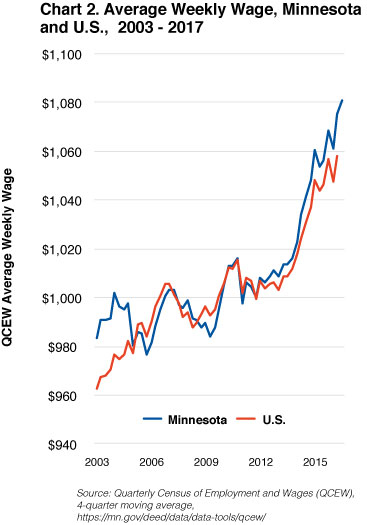
Minnesota's recent average weekly wage acceleration has been stronger than the nationwide uptick (see Chart 2). U.S. average weekly wages rose 5.4 percent between the first quarters of 2013 and 2017, lagging behind Minnesota's 6.9 percent gain. (The 2017 second quarter average weekly wage for the U.S. hasn't been published yet, while Minnesota's is shown in Chart 2.) Minnesota's average weekly wages are once again higher than U.S. average weekly wages after having essentially been equal since 2005.
Other wage data are also showing upward wage pressures in Minnesota as the labor market tightens, forcing employers to increasingly compete for qualified workers at all wage levels. Average weekly earnings as estimated in the Current Employment Statistics program show that Minnesota's recent faster wage growth is due to both longer work weeks and higher hourly wages. Minnesota's average weekly hours, which dipped more than U.S. hours during the recession, are now just slightly lower than U.S. hours (see Chart 3).
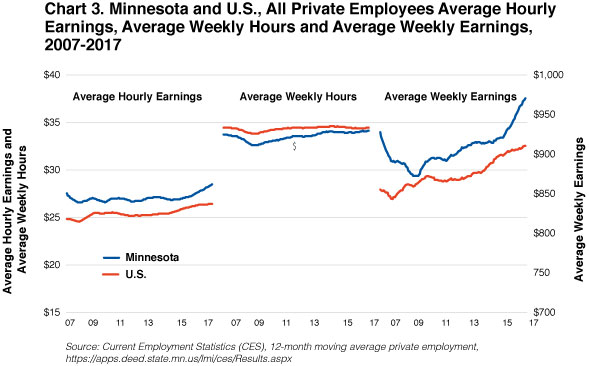
Average hourly earnings growth in Minnesota was modest – like U.S. average hourly earnings – between 2010 and 2015 before accelerating significantly faster than U.S. hourly earnings over the last two years. Higher earnings combined with higher weekly hours boosted Minnesota's average weekly earnings by 5.9 percent from September 2015 to September 2017, compared with only 1.2 percent nationwide.
After moving sideways for at least a decade, real wages are rising in Minnesota across all wage levels. Wage gains for lower-wage groups were higher than higher-wage groups over the last few years, according to Occupational Employment Statistics.
The 10th percentile of annual wages climbed 4.8 percent between 2014 and 2016 in Minnesota, 4 percent for the 25th percentile, 2.6 percent for the 50th percentile, 2 percent at the 75th percentile, and 2.3 percent for the 90th percentile (see Chart 4).
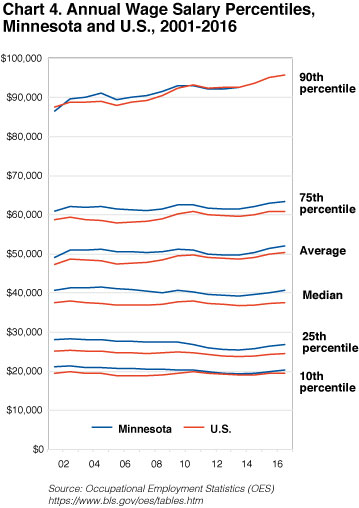
Earnings for workers with below-median wages are still below 2001 pay, but upward pressure on pay for low-wage workers appears to have been stronger during the last few years relative to pay pressure for higher-wage workers. Minnesota pay now exceeds U.S. pay at all levels of wages, except for the highest-paid workers. Minnesota's 90th percentile annual wage is the same as the U.S. 90th percentile annual wage.
Minnesota workers are also reporting that earnings growth has accelerated. Both median and average earnings by Minnesota workers as reported in the American Community Survey have been climbing since 2013 after having tailed off over the previous decade (see Chart 5).
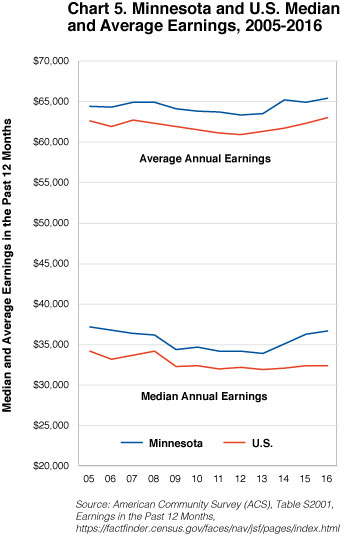
Median annual earnings were up 8.3 percent between 2013 and 2016 in Minnesota, which is significantly higher than the 1.6 percent gain reported nationwide. Median annual earnings for Minnesota workers were still 1.3 percent below the 2001 level in 2016, but Minnesota workers were substantially better off in 2016 relative to workers nationwide. U.S. median earnings in 2016 were still 5.3 percent lower than in 2001.
Minnesota's job market is significantly tighter than the national job market, and the difference is showing up in faster real wage gains in Minnesota than nationally. Faster-growing paychecks in Minnesota may be a drag on employment growth, as Minnesota employers become less competitive in national and international markets due to higher payroll costs. But higher wages in the state could also work on the supply side by boosting immigration into Minnesota by workers seeking higher pay. A faster-growing labor force would be welcomed by Minnesota employers, even if the boost is fueled by higher wages.
1Consistent unemployment rates for Minnesota are available back to 1976 at Local Area Unemployment Statistics. The 2017 estimate is the nine-month average of seasonally adjusted numbers through September.
2Alternative measures of unemployment for Minnesota.
3Minnesota Job Vacancy Survey results are available.
4Five measures of wages are presented here. Detailed information on the five-wage series.
5All wage data presented here have been inflation-adjusted to 2017 dollars using the Consumer Price Index (CPI) for All Urban Consumers.