

by Carson Gorecki and Nick Dobbins
June 2022
After decades of low inflation, Americans are dealing with rapidly rising consumer costs that are more than offsetting wage gains. Minnesotans are not spared the impacts of inflation, which tends to hit lower-income people harder. This article examines the various ways of measuring both wage and other compensation increases and how inflation impacts real purchasing power.
As Minnesota's labor market works to fully recover from the COVID-19 crisis, the mass layoffs and lack of available jobs that defined the onset of the pandemic gave way to a new issue. As employment began to recover, businesses found they had a surplus of jobs and lack of available workers. Minnesota's seasonally adjusted unemployment rate reached an all-time low of 2.2% in April of 2022. At the same time, the seasonally adjusted labor force participation rate (LFPR) is still down from its pre-pandemic peak. While Minnesota still outpaces the nation in LFPR, we hit a low of 67% in March of 2021, a rate we hadn't seen since October of 1977. It has climbed since then, to April's 68.3%, which is still lower than at any other time since 1978.
This combination of low unemployment and low LFPR is a sign of a very tight labor market. Jobs exist, but employers are having difficulties finding enough people to work in them. Hiring difficulties are not consistent across industries, with businesses such as restaurants and nursing homes reporting especially challenging labor markets. When they are able, some employers are raising wages to help encourage the low number of available workers to work for them. As Table 1 shows, recent wage growth has varied across industry and worker class as well, with wages at tough to fill positions in Nursing and Residential Care Facilities up nearly 11% over the year and positions in Food Services and Drinking places up nearly 13% over the year1.
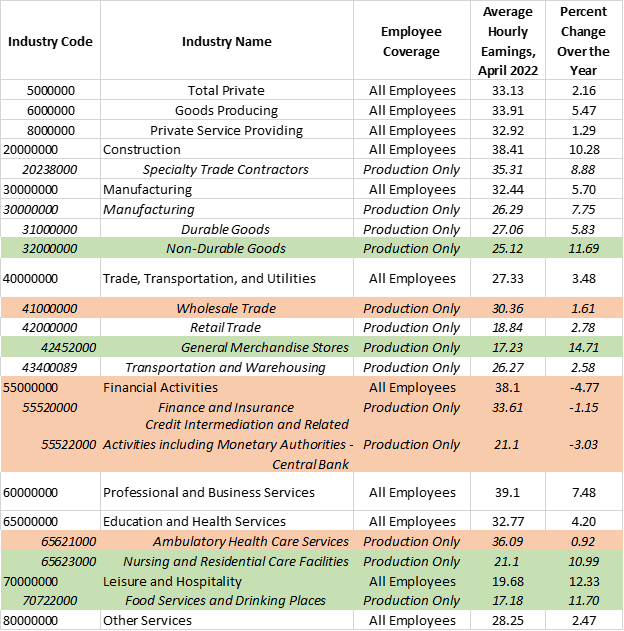
(Top five industry series for Over-the-Year growth highlighted in green. Bottom five highlighted in orange).
The average nonfarm private sector job posted earnings increases of 2.16% from April 2021 to April 2022, but growth varied widely across the smaller industry groups. While multiple published series posted annual wage growth of over 10%, three series posted negative over-the-year wage growth (Financial Activities and two components within that supersector).
In the recent labor market crunch, the positions that are reportedly the hardest to fill have been those for production workers in lower paying industry groups such as food service, nursing homes, and retail sales [1]. It is in many of those same places where we saw wages grow the most over the previous twelve months. Nursing & Residential Care Facilities, Food Services & Drinking places, and General Merchandise Stores are among the five published sectors with the highest annual earnings increase, and they are also among the five with the lowest overall average wage. Correspondingly, Finance & Insurance and Ambulatory Health Care Services (production workers only) are among the published series with the highest average wage, and also posted some of the lowest annual wage growth.
This is, superficially, how one might expect the labor market to react to shortages. Wages increase when there is a labor shortage, and areas where the demand for labor is highest see the largest increase in wages. Employers try to meet demand for workers through increasing the enticement.
As Figure 1 shows, the average hourly earnings of all private sector employees rose sharply as the labor market entered its recent period of recovery. The over-the-year wage growth of 2.16% would have been much higher if not for a recent dip in earnings. March's private sector average hourly earnings was $33.64, 5.2% higher than in March 2021, and average earnings were down $0.51 in preliminary April estimates. It is too early to tell if that marks the beginning of a trend, or a temporary blip in the estimates.
However, while earnings increased in actual dollars, real earnings growth was being held back by another important variable: inflation.
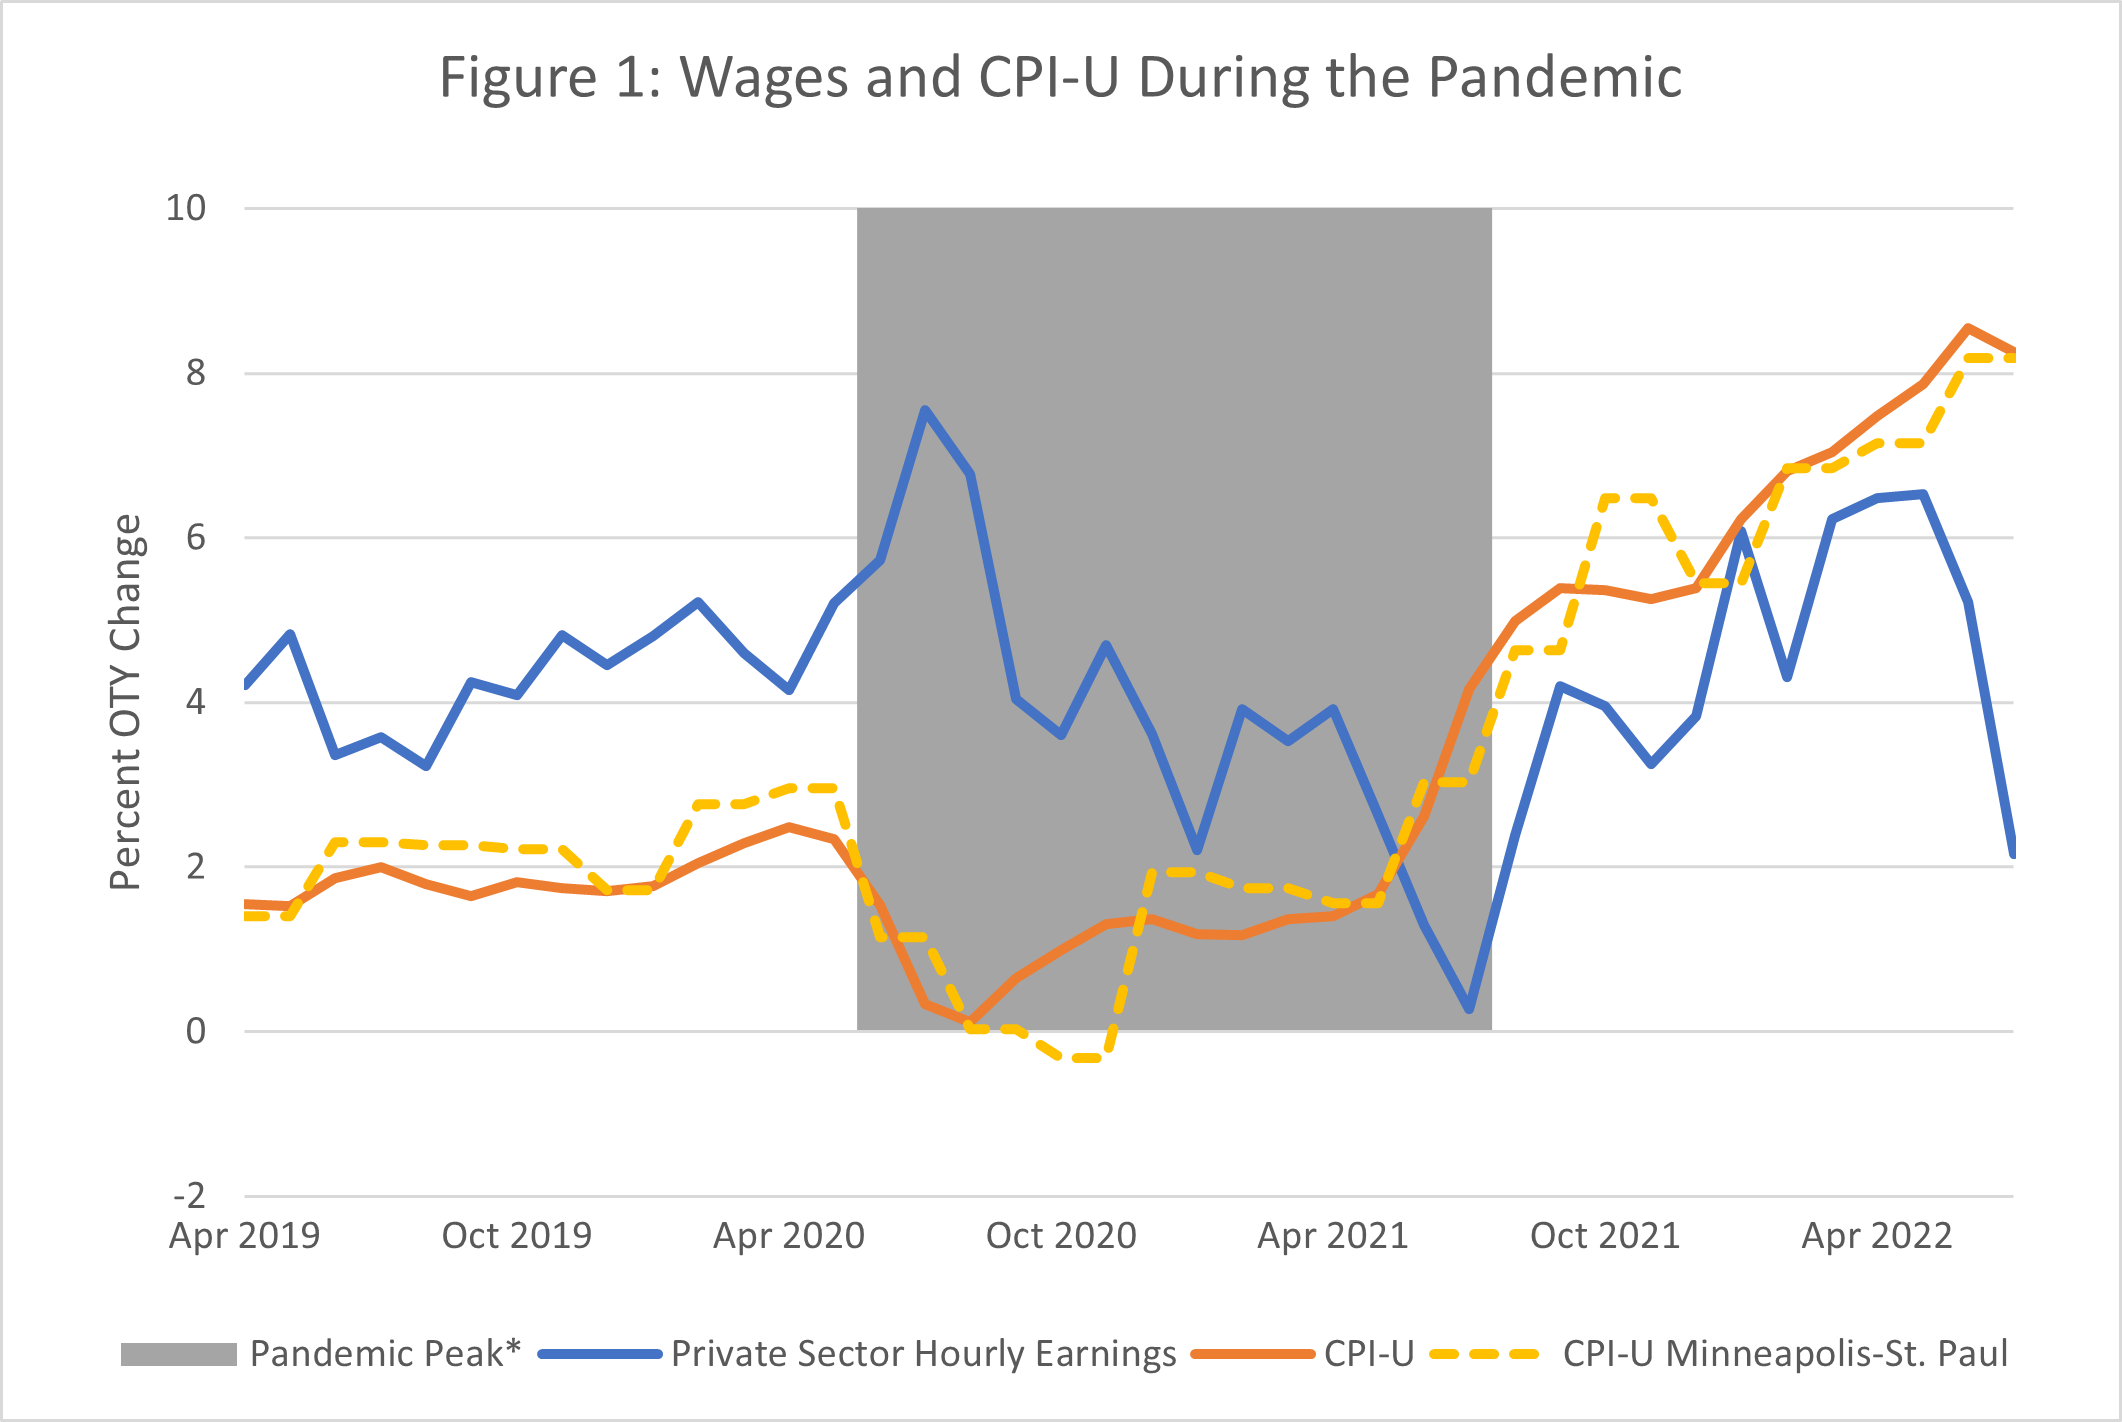
*'Pandemic Peak' extends from the closure of non-essential businesses in March 2020 to May of 2021, when the last statewide capacity restrictions on bars and restaurants were lifted
The Consumer Price Index (CPI) is the most commonly-used measure of inflation in the United States. The CPI-U is an index that tracks retail prices for urban consumers, a category that encompasses roughly 87% of the population of the United States. As prices increase, the purchasing power of money decreases, driving down the real value of each dollar earned. In the post-pandemic recovery period, prices have been increasing quickly.
In March, the growth in CPI-U hit 8.5% over the year, the largest 12-month increase since 1981. The Minneapolis-St Paul CPI-U hit 8.2%, an OTY high not topped since 1982. In terms of annual growth, CPI-U at both the national and state levels have been consistently outpacing growth in average hourly earnings since the economic recovery began in earnest in mid-2021. It also appears that the recent strong inflation growth began occurring prior to wage growth, with both the U.S. and Minneapolis-St. Paul CPI-U beginning sharp growth trends in March 2021, while the wage growth trend did not appear until May 2021 (in fact, both U.S. and Minnesota private sector wages posted sharp declines in March 2022), which suggests that increasing wages are not the primary driver of increasing inflation.
The Consumer Price Index (CPI-U) tracks nationwide inflation. Using this index, $100 in April 2022 dollars would be worth just $92.37 in April of 2021 dollars, and $100 from just before the start of the pandemic (February 2020) would be worth less than $90 now.
The CPI-W is a more specialized index than CPI-U. It tracks retail prices as they affect urban hourly wage earners and clerical workers. The CPI-W places a slightly higher weight on food, apparel, transportation, and other goods and services. It places a slightly lower weight on housing, medical care, and recreation. The CPI-W growth in Minneapolis-St. Paul is even more dramatic than the broader CPI-U, with March's OTY growth at 8.8%. The CPI-W has been growing faster than the CPI-U consistently since the beginning of 2021. Nationwide, the BLS estimates the real (adjusted for inflation) average hourly earnings for production and non-supervisory workers as calculated in 1982 (when the series began) dollars at $9.55, down from $9.77 in April of 2021.
Since January 2021, nonfarm private sector wages in Minnesota posted an average OTY growth of 3.9%, while the CPI's average growth has increased to 5.4% in the Minneapolis-St. Paul area (5.5% nationally). While the current trend is growth in prices to outpace growth in wages, the larger picture is more complex. Between 2008 (the furthest back we have in the series) and 2020, CES average hourly wages for the private sector had an average over-the-year (OTY) growth rate of 2.5%. Over the same period, the Consumer Price Index had an average OTY growth rate of 1.7%.
Looking back even further, income has kept up with, and at times even surpassed the growth of prices over the past several decades. To take this longer view of income and cost trends we turn to an additional measure – real personal income. Real personal income (RPI) includes all income people receive in the form of wages, health and other insurance, salaries, government benefits, interest, and more, and accounts for inflation. As such, RPI provides a broader view of income than wages alone. Additionally, the longevity and consistent publication of RPI by the Bureau of Economic Analysis allows us to compare income to CPI-U as well as to real gross domestic product (GDP) – a measure of inflation-adjusted total productivity – back to the late 1950s.
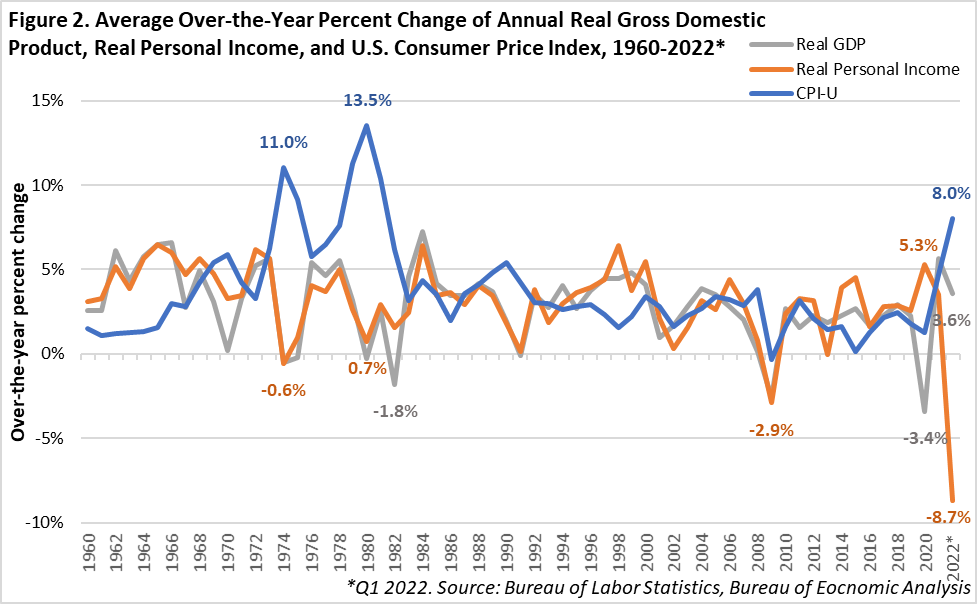
Between 1960 and 2020, the CPI-U and the RPI were more likely than not to track together, with occasional spikes of noticeable divergence (see Figure 2). The average OTY growth rate for the CPI-U between 1960 and 2022 was 3.7%. Over the same period, the average RPI OTY growth rate was 3.2% and real GDP was 3%. However, if the 1970s and 1980s – two decades with some of the highest recorded inflation – are excluded, the CPI-U average growth rate dropped to 2.9% while personal income held steady at 3.2% and real GDP stayed at 3%. Of the nearly 250 quarters since 1960, over-the-year growth of real personal income was greater than CPI-U growth 54% of the time.
Real GDP, which fell significantly in 2020, rebounded strongly just as rising prices accelerated. Yet real income, which had been buoyed by stimulus payments in 2020 and early 2021, has dropped significantly since. The result is two separate divergences, first between OTY change in real GDP and RPI in 2020 and then between RPI and CPI-U in the most recent quarters and months. The scale of the recent divergence between CPI-U and RPI is even greater than during the previous significant inflationary spikes experienced in the 70s and 80s. Part of the reason for the recent fall in RPI growth is that the base period for annual growth included two of the economic stimulus payments. The one-time payments likely impacted demand for goods and services (a variable in inflation) as well, making the trend of divergence somewhat more difficult to parse. The recent divergence of real GDP and RPI is also a departure from trends over the previous five decades.
Another measure used to track total compensation over time is the employment cost index (ECI). The Bureau of Labor Statistics has produced the ECI since 2001. Like real personal income, the ECI incorporates not only wages and salaries, but also benefits such as health insurance, retirement plans, and paid leave. The ECI is also useful for measuring how the total costs of compensating workers has or has not kept up with inflation.
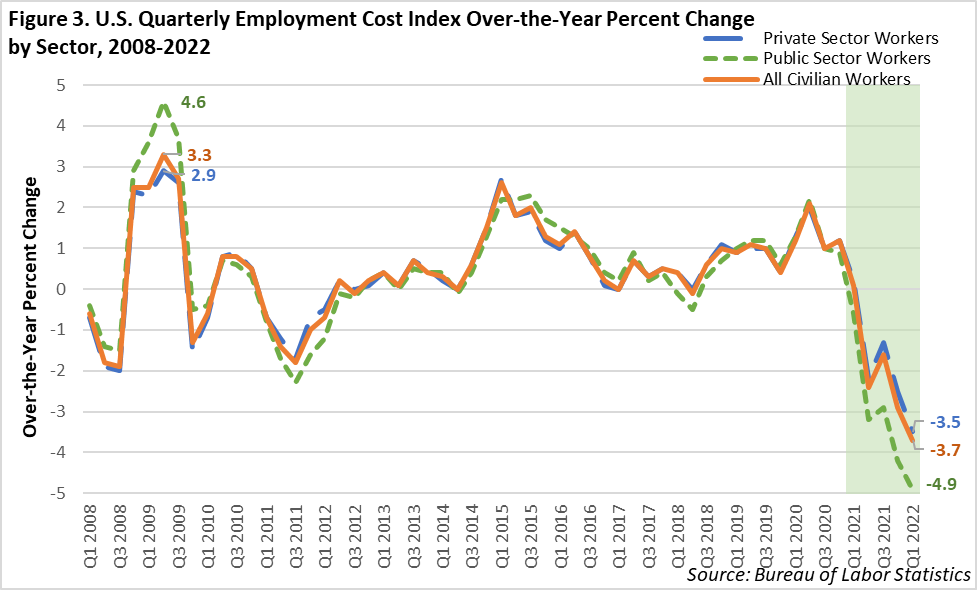
One benefit that the ECI has over RPI is the additional detail it provides by including compensation type (wages & salaries vs. benefits) and sector (public vs. private). Additionally, the ECI is not as impacted by stimulus payments which are a form of income but do not directly affect the costs of employing workers. For the better part of the twenty-year series, wage & salary trends matched that of benefits. Similarly, public sector compensation moved – for the most part – in tandem with private sector compensation. A notable exception was during the Great Recession when public sector compensation grew relatively faster than private sector compensation. However, parity was again largely the case until second quarter 2021. Since then, there has been a noticeable divergence of compensation by type as well as sector.
Over the year into first quarter 2022, inflation adjusted total compensation for all workers was down 3.7%. Wages and salaries were down 3.6% while total benefits were down 4.2% over the year. Additionally, it appears that private sector employers were more able to respond to the rapidly rising prices and tight labor market conditions that took hold in early 2021. Despite a decline in the ECI, private sector compensation, which was down 3.5%, kept better pace with inflation than public sector compensation, which was down 4.9% (see Figure 3). In fact, private sector workers saw all compensation types decrease less than their state and local government counterparts, relative to inflation. Since much of the largest relative wage growth occurred in low wage industries and occupations, many government workers, who receive above average compensation, may have seen smaller increases. The recent divergence in compensation by sector may also be partly attributable to the larger share of public sector compensation dedicated to benefits. As of the end of 2021, total benefits represented 29.5% of private sector total compensation and 38% of total public sector compensation.
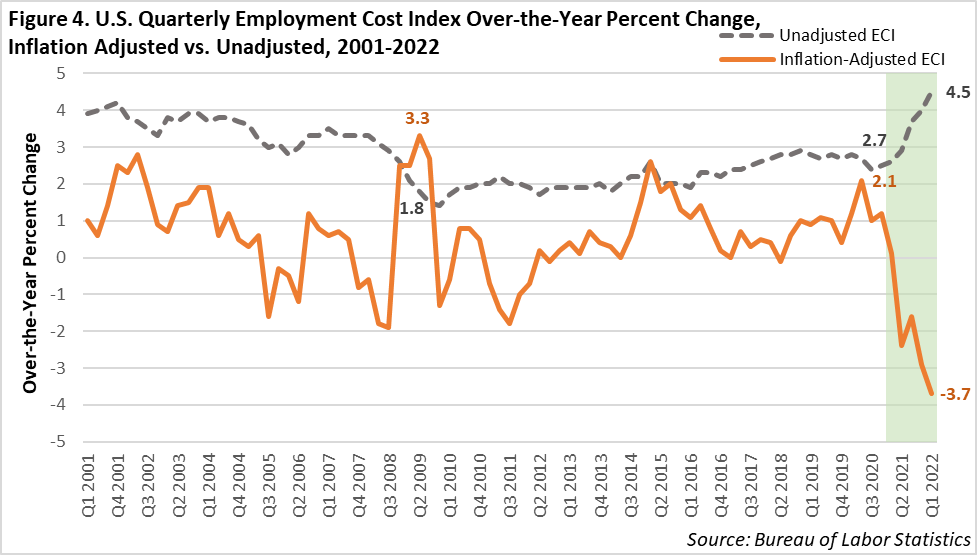
During the previous downturn in the Great Recession, the cost of employing workers behaved very differently than during the COVID-19 recession and its aftermath. Inflation-adjusted ECI grew rapidly in 2008 and 2009 while the unadjusted ECI declined, reflecting the staying power of labor compensation as the growth of prices stalled. However, as prices have grown over the last two years, the growth of worker compensation has not kept pace. The growing compensation-price disparity is clearly demonstrated via a comparison of inflation adjusted ECI to non-adjusted ECI (see Figure 4). Inflation transforms what appears to be robust growth in worker compensation into a significant relative decrease.
There are a wide variety of ways to measure inflation over time. This is one reason why exploring the relationship between inflation and wages is a complex pursuit. However, the available data seems to clearly show that over the short term, prices have been growing faster than wages for most workers, while over the longer-term, earnings and inflation tend to track more closely, with exceptions during unique moments in the economic cycle, such as the one we are in currently. Whether we revert to prior trends as the recovery continues or whether new trends in earnings and inflation emerge remains to be seen.
1Macht, Cameron: Minnesota Vacancies Surge in 2021. Minnesota Economic Trends, December 2021.