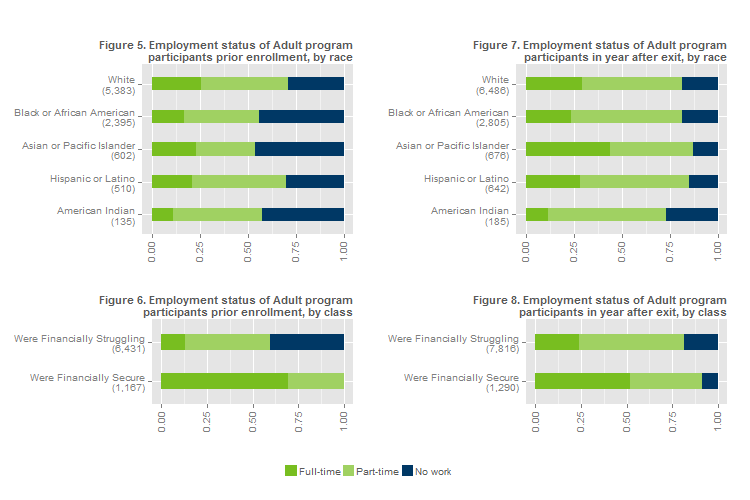
Figures 5 through 8 show the full-time and part-time employment status before and after participation in the Adult program. See more about the data sources used in this report in Appendix C. Read our definitions of race, class, and employment in Appendix D.

Across all racial groups in the Adult program, part-time work is more common than full-time work and one quarter to one half of participants in each racial group have had no work at all in the year prior to participation (Figure 5). This is in stark contrast to the rates shown for the Dislocated Worker program.
White and Hispanic or Latino participants in the Adult program are the most likely to be employed in the year prior to participation: nearly three quarters are working either full time or part time. White, Asian or Pacific Islander, and Hispanic or Latino participants are the most likely to be employed full time (roughly 20-25%).
Among those who were financially struggling prior to participation, only 13% were working full-time - compared to 70% among those who were financially secure (Figure 6). Over 40% of those struggling financially had no work at all.
Employment rates increase in each racial group in the year after program exit compared to the year before participation, especially among Black or African American participants and Asian or Pacific Islander participants. The result is a partial reduction in the racial employment gap among Adult program participants (Figure 7). This increase in employment is driven mostly by part time work. Asian and Pacific Islander participants see a significant boost into full time work, but the full time employment rates inch up or are stagnant for other racial groups.
We also see reduced but still large employment disparities by class: full-time employment rates increase among those who were financially struggling prior to participation, but decrease among those who were financially secure (Figure 8). Part-time employment increases among both groups, and a portion (9%) of those who were financially secure before participation are unemployed after participation.