by Oriane Casale, Sue Hartley, Bettsy Hjelseth, and Tim O'Neill
September 2019
Once again the number of job vacancies in Minnesota has hit an all-time high. In the second quarter of 2019 employers across the state reported 146,513 job vacancies. In the second quarter of 2018 Minnesota had 142,282 job vacancies. The job vacancy rate in the second quarter of 2019 was 5.3 percent or 5.3 vacancies per 100 jobs. This is the highest job vacancy rate the state has had since the job vacancy survey began in 2001. The median hourly wage offer for these 146,513 vacancies was $15.00, which was a slight increase from the previous year's $14.54.
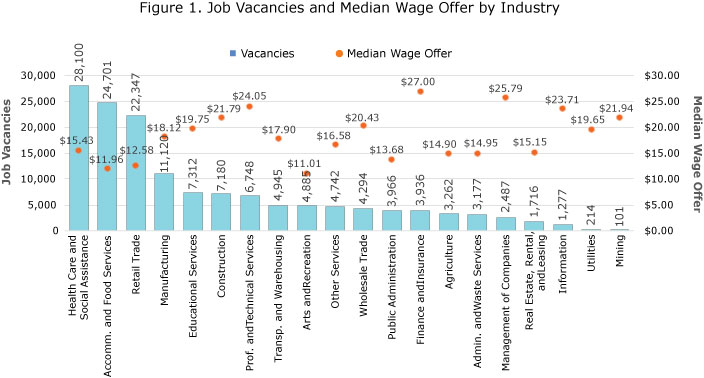
Minnesota is experiencing tight labor market conditions. With a record high number of job vacancies, a record high job vacancy rate, and low unemployment, there are more vacancies than people looking to fill them. So where is most of the demand? The top three industries with job openings in the second quarter of 2019 were Health Care and Social Assistance (28,100 job vacancies), Accommodation and Food Services (24,701 job vacancies), and Retail Trade (22,347 job vacancies). These three industries accounted for over half (51.3 percent) of the state's total job openings (see Figure 1). The highest such rates were in Agriculture, Forestry, Fishing, and Hunting (14.9 percent), Accommodation and Food Services (10.5 percent), and Arts, Entertainment, and Recreation (9.0 percent).

For all industries the highest median hourly wage offerings were in Finance and Insurance ($27.00), Management of Companies and Enterprises ($25.79), and Professional and Technical Services ($24.05). Vacancies in these industries typically require more post-secondary education. Those industries where post-secondary education is most often required include Professional and Technical Services (73 percent), Educational Services (73 percent), and Management of Companies and Enterprises (60 percent).
Besides showing industry sectors, the job vacancy survey also allows you to analyze demand by occupational groups and specific occupations. For example, the top three occupations with the highest number of vacancies in Minnesota were Retail Salespersons (7,811 vacancies), Combined Food Preparation and Serving workers (7,186 vacancies), and Personal Care Aides (6,181 vacancies). These three occupations accounted for 14.5 percent of total vacancies. Table 1 lists the top 10 occupations with the most vacancies in the state. Of those 10 occupations, the vacancy rate was the highest for First-Line Supervisors of Food Preparation and Serving Workers (20.2 percent), Social and Human Service Assistants (17.1 percent), and First-Line Supervisors of Retail Sales Workers (16.6 percent). With a large number of vacancies and robust vacancy rates, the need for workers in these three occupations is especially high.
If you take a closer look at these top 10 occupations with the most vacancies, you will notice that their median hourly wage offers are typically lower. Except for Heavy and Tractor-Trailer Truck Drivers and First-Line Supervisors of Food Preparation and Serving Workers, each occupation had a median hourly wage offer below the median hourly wage offer for the total of all occupations, $15.00 (see Table 1). You should also notice that these occupations do not require high levels of post-secondary education, if any at all.
| Table 1. Top 10 Occupations with the Most Vacancies in Minnesota, Q2 2019 | |||||
|---|---|---|---|---|---|
| Occupation | Vacancies | Vacancy Rate | Median Hourly
Wage Offer |
2016 – 2019 Change | |
| Percent Change in Vacancies | Median Hourly Wage Offer | ||||
| Total, All Occupations | 146,513 | 5.3% | $15.00 | 50.1% | 7.1% |
| Retail Salespersons | 7,811 | 8.9% | $12.06 | 125.9% | 8.7% |
| Combined Food Prep and Serving Workers | 7,186 | 10.9% | $11.10 | 136.7% | 13.5% |
| Personal Care Aides | 6,181 | 8.2% | $12.05 | 82.4% | 9.8% |
| Cashiers | 3,641 | 5.5% | $11.41 | 58.3% | 13.6% |
| First-Line Supervisors of Retail Sales Workers | 3,375 | 16.6% | $14.99 | 98.2% | 11.5% |
| First-Line Supervisors of Food Prep and Serving Workers | 3,256 | 20.2% | $15.32 | 70.2% | 32.4% |
| Nursing Assistants | 3,245 | 10.3% | $14.00 | 31.6% | 8.7% |
| Waiters and Waitresses | 2,692 | 5.3% | $10.21 | 32.9% | 14.2% |
| Heavy and Tractor-Trailer Truck Drivers | 2,659 | 7.6% | $20.97 | 32.6% | 29.8% |
| Social and Human Service Assistants | 2,567 | 17.1% | $14.97 | 301.1% | 15.3% |
| Source: MN DEED Job Vacancy Survey | |||||
Demand for workers across Minnesota is rising. More specifically, the number of total job vacancies increased by 50.1 percent between the second quarters of 2016 and 2019. This is equivalent to nearly 50,000 more job vacancies. For those occupations with the most current vacancies, growth since 2016 has been highest for Social and Human Service Assistants (301.1 percent), Combined Food Preparation and Serving Workers (136.7 percent), and Retail Salespersons (125.9 percent). All of these occupations witnessed higher wage growth between the second quarters of 2016 and 2019 than overall wage growth.
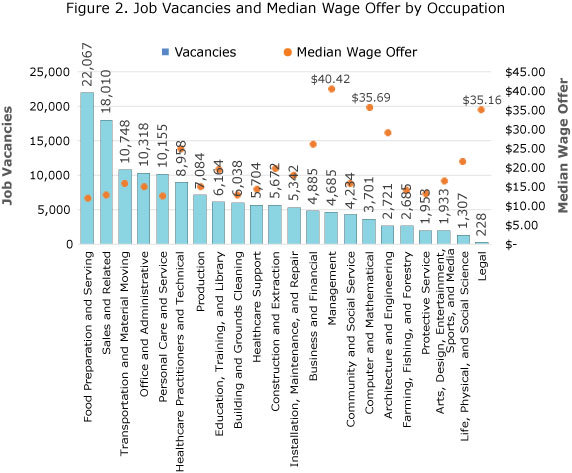
Zooming out, the three major occupational groups with the most job openings during the second quarter of 2019 were Food Preparation and Serving (22,067 job vacancies), Sales and Related (18,010 job vacancies), and Transportation and Material Moving (10,748 job vacancies). These three occupational groups accounted for over one-third (34.7 percent) of total job openings. The vacancy rate was highest in Farming, Fishing, and Forestry (67.5 per 100 filled jobs), Food Preparation and Serving (9.1), and Community and Social Service (7.3). Those occupational groups with the highest median hourly wage offerings were Management ($40.42), Computer and Mathematical ($35.69), and Legal ($35.16) (see Figure 2).

Regionally 86,044 or 58.7 percent of all job vacancies were in the Twin Cities Seven-County Metro Area. Greater Minnesota had 60,469 or 41.3 percent of all job vacancies. The job vacancy rate for the Twin Cities Metro Area and Greater Minnesota were 5.0 and 5.8, respectively. The overall median wage offer in the Twin Cities Metro Area was $15.88, which compared to $14.04 in Greater Minnesota. The Twin Cities Metro Area had 0.6 job seekers for each vacancy, and Greater Minnesota had 0.8 job seekers for each vacancy.
Job vacancy data for Greater Minnesota can be broken down even further. For example, Southeast Minnesota had the highest number of job vacancies in Greater Minnesota with 13,672, while Northeast Minnesota had the lowest number of job vacancies with 7,885. Southwest Minnesota had the highest job vacancy rate at 7.0 percent, while Central Minnesota had the lowest job vacancy rate at 4.9 percent. Central Minnesota had the highest median hourly wage offer at $14.55, while Northeast Minnesota had the lowest median hourly wage offer at $13.13. By industry Health Care and Social Assistance accounted for the highest number of vacancies in each planning region of Minnesota, except for Northeast Minnesota where Accommodation and Food Services took the top spot.
| Table 2. Job Vacancies by Minnesota Planning Region, Q2 2019 | ||||||
|---|---|---|---|---|---|---|
| Minnesota Planning Region | Number of Job Vacancies | Job Vacancy Rate | Median Wage Offer | Require Post-Secondary Education | Requiring One Plus Years Experience | Requiring Certificate or License |
| Northwest | 13,020 | 5.8% | $14.28 | 21% | 30% | 36% |
| Northeast | 7,885 | 5.5% | $13.13 | 23% | 39% | 36% |
| Southwest | 12,458 | 7.0% | $13.85 | 22% | 37% | 37% |
| Southeast | 13,672 | 5.6% | $14.38 | 21% | 37% | 30% |
| Central | 13,434 | 4.9% | $14.55 | 28% | 41% | 33% |
| Twin Cities | 86,044 | 5.0% | $15.88 | 34% | 51% | 32% |
| Source: MN DEED Job Vacancy Survey | ||||||
While the number of job vacancies has continued to increase over time, the educational requirements to fill the open positions have also changed. Where change has been the most significant is for those job vacancies requiring either no formal education or bachelor's degrees. For example, in the second quarter of 2013, an estimated 25 percent of job vacancies required no formal education. As of the second quarter of 2019, that share has increased to 37 percent. On the other end of the spectrum, in the second quarter of 2013, 21 percent of job vacancies required a bachelor's degree. As of the second quarter of 2019, that number has decreased to 14 percent.
The amount of work experience required for job vacancies has also changed dramatically between the second quarters of 2013 and 2019. In the second quarter of 2013 one-third (33 percent) of vacancies required less than one year of experience. This increased to over half (55 percent) in the second quarter of 2019. In the second quarter of 2013, nearly two in five vacancies (39 percent) required four or more years of experience. This decreased to one in 10 vacancies (10 percent) in the second quarter of 2019. These changes show that over time the job vacancies we are seeing across the state are typically requiring less education and experience to fill. This may be caused by the increased and persistently tight labor market conditions being felt by employers across Minnesota.