by Rachel Vilsack
September 2013
Monthly employment numbers tell only part of the story about Minnesota's labor force. New statistics offer a more revealing look at unemployment in the state, breaking down the numbers by race, gender, education and other characteristics.
DEED provides an up-to-date snapshot of the Minnesota and regional labor markets with the release of the employment numbers and jobless rate each month. This information is essential for tracking trends and comparing labor market conditions across the country.
Many people, though, want to see more in-depth statistics on how certain populations in the state are faring. Instead of monthly statistics, annual estimates are used to assess differences in unemployment rates by gender, education, race, ethnicity and more. The release of the "Geographic Profile of Employment and Unemployment" report in August is an opportunity to see what some of those differences were in 2012.
The Current Population Survey (CPS), sponsored by the Bureau of Labor Statistics (BLS) and the U.S. Census Bureau, is the primary source of labor force statistics nationally, including the U.S. and state unemployment rates. The survey provides the most comprehensive data available for understanding the labor force. The "Geographic Profile of Employment and Unemployment" report summarizes CPS employment data for states and metropolitan areas, examining a variety of characteristics including:
"Geographic Profile of Employment and Unemployment" reports, dating back to 1997, are available online at the Bureau of Labor Statistics.
The CPS is the source of data for estimating Minnesota's unemployment rate. Detailed survey questions capture household attachment to the labor force by identifying whether people are available and actively seeking work. The key to defining unemployment is a connection to the labor force. Those who are discouraged (haven't looked for work) or have a marginal attachment (aren't currently available to work) to the labor force are not counted in the measurements used to produce the unemployment rate. In 2012, Minnesota's unemployment rate averaged 5.8 percent, tied for 10th lowest in the country with Utah and sixth lowest among the 12 states in the Midwest.6
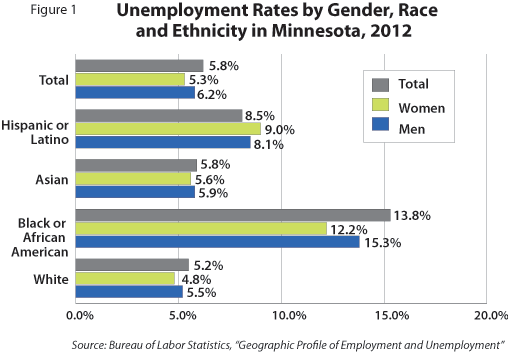
Figure 1 shows the unemployment rates for Minnesotans by gender, race and ethnicity in 2012. Unemployment rates for women were 1 percent lower than the rates for men. Among states, Minnesota tied with Kansas for the seventh-lowest unemployment rate among women. Unemployment rates for women were lower than average in all but 12 states.
Unemployment rates for teens (ages 16 to 19) averaged 18.6 percent in 2012. Across states, teen unemployment rates ranged from 10.8 percent in Montana to 34.6 percent in California.
Basic labor force statistics are also available for married men (spouse present), married women (spouse present) and for women who maintain families. In 2012, the unemployment rates for married men and married women were lower than average, at 3.8 percent and 3.2 percent, respectively. The unemployment rate for Minnesota women who maintain families was 10.2 percent, nearly twice the average.
There is a stark difference in Minnesota unemployment rates by race and ethnicity. For states with reportable rates for black or African American residents, Minnesota ranks near the middle with an average unemployment rate of 13.8 percent in 2012 - on par with the national unemployment rate for African Americans. Asian unemployment rates averaged 5.8 percent and Hispanic or Latino unemployment rates were 8.5 percent in 2012.
Unemployment rates for all groups in Minnesota declined in 2012 (see Table 1). The unemployment rate for African Americans in Minnesota is down from 20.7 percent in 2011 and a decade-long high of 22.5 percent in 2009. Recent unemployment rates for Asian and Hispanic or Latino Minnesotans remains above pre-recessionary levels.
| Minnesota Unemployment Rates by Race and Ethnicity, 2000-2012 | |||||
|---|---|---|---|---|---|
| Total | White | Black or African American | Asian | Hispanic or Latino | |
| 2000 | 3.3% | 3.0% | 7.0% | NA | NA |
| 2001 | 3.7% | 3.5% | 9.4% | NA | NA |
| 2002 | 4.4% | 4.0% | 11.4% | NA | 5.6% |
| 2003 | 5.0% | 4.6% | 10.7% | 7.8% | 5.6% |
| 2004 | 4.8% | 4.3% | 12.9% | 5.0% | 6.4% |
| 2005 | 3.9% | 3.5% | 11.9% | 3.7% | 4.2% |
| 2006 | 4.0% | 3.6% | 10.7% | 5.6% | 4.7% |
| 2007 | 4.6% | 4.1% | 15.8% | 2.8% | 7.1% |
| 2008 | 5.5% | 5.0% | 16.9% | 5.5% | 7.4% |
| 2009 | 7.8% | 7.1% | 22.5% | 7.9% | 15.5% |
| 2010 | 7.3% | 6.4% | 22.0% | 11.7% | 12.3% |
| 2011 | 6.5% | 5.6% | 20.7% | 9.2% | 8.6% |
| 2012 | 5.8% | 5.2% | 13.8% | 5.8% | 8.5% |
| Source: Bureau of Labor Statistics, "Geographic Profile of Employment and Unemployment" | |||||
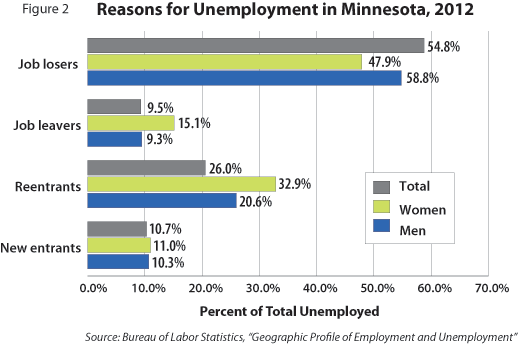
Unemployment is based on the status of people at the time they began to look for work. People are divided into four groups based on their reason for unemployment. In Minnesota, about 54.8 percent of the unemployed in 2012 were job losers, comprising persons whose employment ended involuntarily including those who completed temporary jobs. About 10 percent were job leavers, or people who quit or otherwise voluntarily terminated their employment. One in four unemployed people were considered re-entrants who had previously worked but were out of the labor force prior to beginning their job searches. Finally, 10.7 percent were new entrants who had never worked.
Figure 2 displays the reasons for unemployment for Minnesota men and women in 2012. Job losers made up the majority of reasons for unemployment in Minnesota. Women made up a higher share (11 percent) of new entrants to the labor market in 2012 and a higher share (15.1 percent) of job leavers. Not surprisingly, nearly one-third of Minnesota women were re-entrants to the labor market in 2012, indicating that they were returning to job search activity after some time away from the job market.
Across the country, the average duration of unemployment ranged from 17.3 weeks in North Dakota to 50 weeks in the District of Columbia in 2012. Minnesota and New Mexico tied for 16th among states, with an average unemployment duration of 32.6 weeks. Among the 12 Midwestern states, Minnesota ranks in the middle, having neither the lowest (North Dakota at 17.3 weeks) nor the highest (Illinois at 44.5 weeks) average duration.
Figure 3 provides the duration of unemployment in Minnesota in 2012 in average weeks and median weeks for various characteristics of the unemployed. While the state's average duration of unemployment is 32.6 weeks, the median or midpoint number of weeks of unemployment duration was 13.2. The difference in the median and average weeks of unemployment suggests that there are people who have been unemployed for long periods. In fact, nearly 55,000 Minnesotans were unemployed for 27 weeks or more in 2012, accounting for one-third of the total number of unemployed.
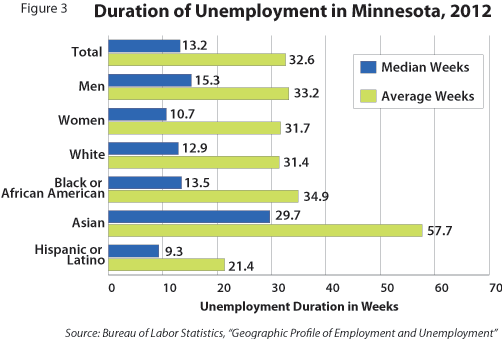
Minnesota women had slightly shorter average unemployment duration (31.7 weeks) than men (33.2 weeks). By race, the average unemployment duration was longest for Asians at 57.7 weeks. While the Asian population had the lowest unemployment rate (5.8 percent) among racial and ethnic groups, Asians were more likely to be unemployed for a longer time. The black or African American population had an average unemployment duration of 34.9 weeks, which is significantly lower than the 53.1 weeks of unemployment in 2011. The Hispanic or Latino population had the shortest average unemployment duration at 21.4 weeks.
Three out of 10 unemployed workers in Minnesota were seeking part-time work. Of the 44,000 people seeking part-time employment, more than one-third of them were between ages 16 and 19, reflecting the educational attachment of teens. This is the only age category for which data are available.
Figure 4 explores the percentages of unemployed people seeking part-time or full-time work by gender, race and ethnicity.7 A higher percentage of women were seeking part-time work (27.4 percent) than men (15.6 percent). There was little difference between the types of employment sought by the White, African American and Hispanic or Latino unemployed populations.
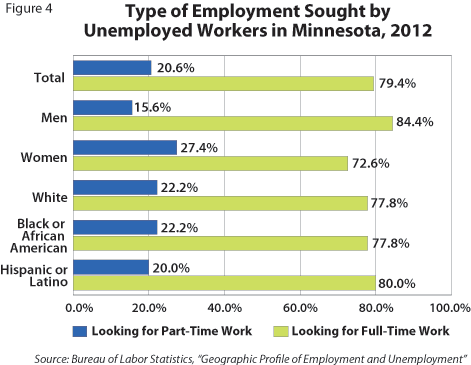
Figure 5 displays unemployment rates by educational attainment for people 25 and over in Minnesota in 2012. Trends have long shown that the higher the level of education the lower the unemployment rate. In 2012, adults with no high school diploma had an unemployment rate that was four times larger (12.4 percent) than adults with a bachelor's degree or higher (2.9 percent).
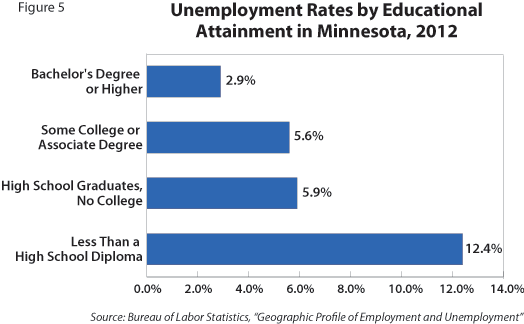
Unemployment data for Minnesota residents by characteristic provides a more complete picture of 2012 labor market conditions. While unemployment rates remain higher than average for the black or African American demographic, they have fallen considerably from recessionary highs of more than 20 percent. The duration of unemployment is also higher than average among Asians and African Americans in Minnesota. Women, on average, fared better in 2012 with an unemployment rate 1 percent lower than men. Women were also more likely to be re-entrants into the labor market and to seek part-time work. Finally, education remains highly correlated with unemployment, with Minnesotans with no high school diploma experiencing the highest unemployment rates in 2012.
1Labor force data for American Indians are not included in the "Geographic Profile of Employment and Unemployment" report.
2Persons of Hispanic or Latino ethnicity may be of any race.
3Limited data are available for this population.
4Limited data are available for this population.
5Limited data are available for this population.
6Unemployment rates in the "Geographic Profile of Employment and Unemployment" report may differ slightly from unemployment rates produced by the Local Area Unemployment Statistics program in Minnesota's Labor Market Information Office.
7Data for Asian Minnesotans were not available.