
by Carson Gorecki
December 2020
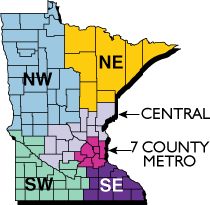 The Northwest and Northeast Planning Regions – the two largest regions by area in the state – encompass what is essentially the northern half of Minnesota. While the Northwest and Northeast regions share many characteristics, the impact of COVID-19 on each region’s labor market has been very different. This article examines preliminary data to determine why the Northwest has fared better than the Northeast in terms of both jobs lost and job recovery so far during the pandemic.
Northwest includes 26 counties and has just over 570,000 residents while Northeast is home to about 325,000 people in seven counties. Both are sparsely populated, and as the only two regions with more than a fifth of their inhabitants at least 65 years old, they share a populace that is older than the rest of Minnesota.
Known for their extensive pine forests and picturesque lakes, the two regions also share natural resource-focused economies. Goods-producing sectors such as mining, agriculture, and logging account for larger shares of employment in northern Minnesota than in the rest of the state. Both regions also rely heavily on the service-providing tourism industry. Combined, the Leisure and Hospitality and Natural Resources and Mining sectors accounted for 12.7% of jobs in Northwest and 15.9% of jobs in Northeast in the first quarter of 2020, compared to only 10.4% of all jobs statewide.
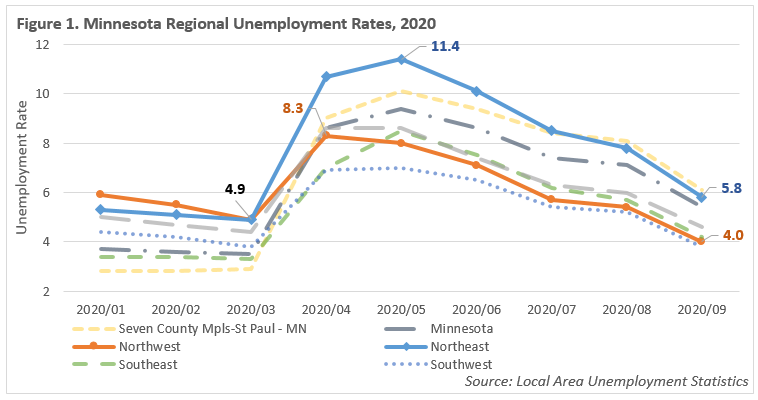
In many respects, Northwest and Northeast Minnesota are similar. Through March 2020, prior to the onset of major impacts from the COVID crisis, the regions also shared an identical unemployment rate of 4.9%. From that point however, the two region’s labor market fates have diverged. The unemployment rate in Northeast peaked in May at 11.4% before falling to 5.8% in September. By comparison, the unemployment rate in Northwest peaked at a much lower 8.3% and fell to 4.0% in September, a rate lower than the pre-pandemic figure (see Figure 1).
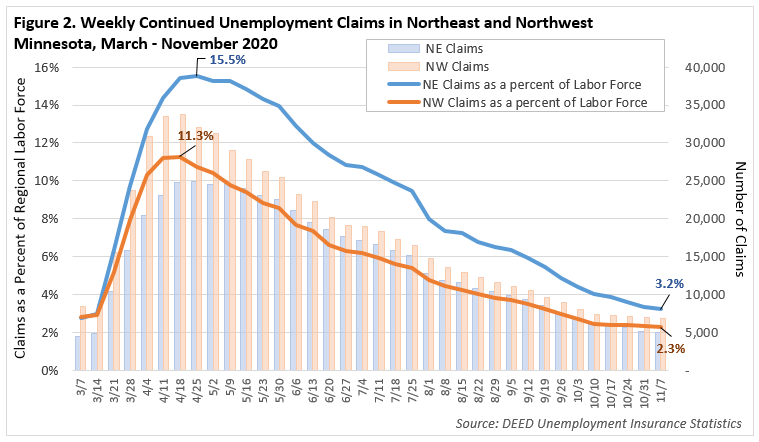
Like unemployment rates, Unemployment Insurance (UI) claims provide additional detail on the regions’ divergent paths through the pandemic. The trend of continuing claims over time provides a look at both the initial impacts as well as the relative recoveries of the two regions thus far. The more populous Northwest region saw a higher and earlier peak of claims (shown by the bars in Figure 2). However, the Northeast saw more claims relative to the size of its labor force (shown by the lines in Figure 2).
Both regions saw significant declines in UI continued claims from the surge in mid-April and early-May. Since their relative peaks, those declines occurred at roughly the same rate, falling about 80%. This trend means that Northwest claims have actually fallen below their pre-pandemic number, while claims in Northeast remain higher than they were in early March. Likewise, the number of claims relative to the labor force remains higher in the Northeast region. So, while Northwest saw higher numbers of claims due to a larger population, claims in Northeast climbed faster initially. As a result, the disparity in relative impacts that developed early still remains eight months later as each economy works to recover (see Figure 2).
Why might these two neighboring economies have experienced the pandemic in such divergent ways? Why was Northeast hit harder initially and what can explain why Northwest appears to have been more insulated? Recently released Quarterly Census of Employment and Wages (QCEW) data for the second quarter provide us with the detailed industry information necessary for a closer look.
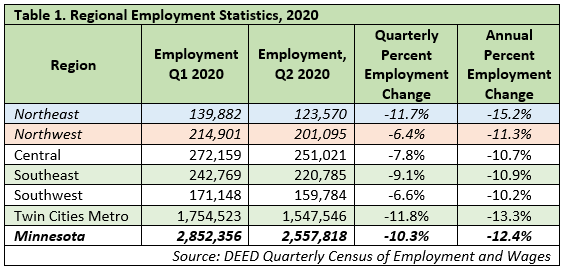
Typically, employment levels increase in the second quarter as seasonal sectors such as Construction and Leisure and Hospitality add jobs for the summer. Of course, 2020 has been anything but typical. With the onset of the pandemic at the end of the 1st quarter came a decline in employment across the state of 10.3%. At -11.7%, Northeast saw the second largest decline, just behind the Twin Cities Metro. The Northwest region, however, saw the smallest quarterly decline of all regions, falling just 6.4% from Quarter 1. Additionally, the QCEW data show that employment in Northeast fell 15.2% compared to the 2nd quarter of 2019, while Northwest employment declined by 11.3%. That was less than the statewide year-over-year decline of 12.4%, which was largely driven by declines in the Twin Cities Metro (see Table 1).
Northeast Minnesota’s relatively larger employment losses and Northwest Minnesota’s relative insulation from losses cannot be explained by one simple trend or the performance of a single industry. Variations in some key industries help discern the different outcomes.
First, the simplest explanation is that the industries most impacted by the pandemic were more concentrated in Northeast. Arts, Entertainment, and Recreation, Accommodation and Food Services, Other Services, Administrative Support and Waste Management Services, Retail Trade, and Mining were the industries with the greatest employment losses over the year. Of those six, all but Retail were more concentrated in Northeast than in Northwest. In addition, annual employment losses were more severe in Northeast in all six of the hardest hit industries. The differences in concentration were for the most part modest, but were amplified by the relatively higher employment losses (see Table 2).
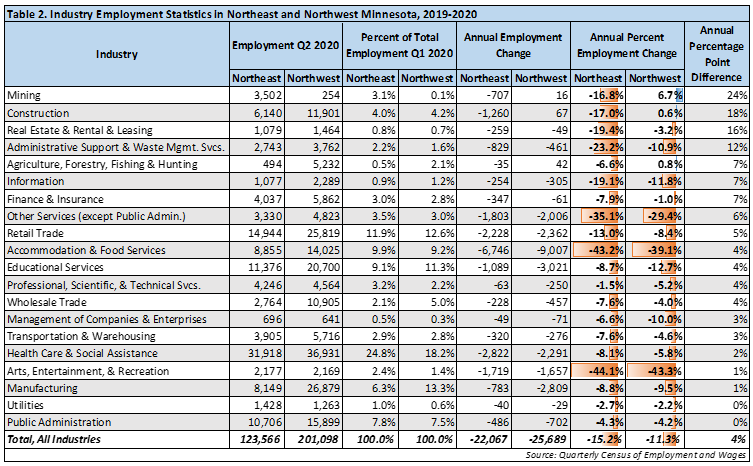
Health Care and Social Assistance is the largest industry in both regions, accounting for 24.8% and 18.2% of jobs in the Northeast and Northwest respectively prior to the pandemic. In the Northeast region, employment in Health Care and Social Assistance fell 8.1% over the year, the equivalent of 2,822 fewer jobs. At -5.8%, which represents a loss of 2,291 jobs, the employment cuts in Northwest’s Healthcare sector were relatively and absolutely smaller. Even though the employment change percentage point difference between the regions was relatively small compared to other industries, the overall size of Health Care and Social Assistance means that each percentage point equated to more actual jobs and the difference carried more weight in Northeast. Health Care and Social Assistance represented 12.8% of Northeast annual employment decline, but only 8.9% of Northwest’s.
Perhaps unsurprisingly given the previous two paragraphs, most industries in Northwest fared better than their Northeast counterparts. In fact, in only four out of 20 cases did an industry in the Northeast region outperform the Northwest. Educational Services, Professional, Scientific, and Technical Services, Management of Companies, and Manufacturing experienced relatively less employment loss in the Northeast region.
To put a finer detail on the point, industries representing more than 80% of total employment in the Northeast saw greater annual percent losses than the same industries in Northwest. Conversely, the share of employment in Northwest industries that saw larger percent declines relative to the Northeast was only 27%. While there were instances of Northeast faring better, they either occurred in relatively small industries such as Management of Companies or, as was the case in Manufacturing, the difference in percent employment change was not very significant (see Table 2). Manufacturing jobs were also much less concentrated in Northeast, muting the region’s small edge in percent employment change.
Divergent employment outcomes between the two regions also occurred when industries encompassed similar shares of employment but varied by employment. Prior to the pandemic, Construction represented roughly equal shares of employment in each region – about 4%. Yet in Northeast, Construction jobs fell 17% in comparison to the second quarter of 2019, but increased modestly in the Northwest region by 0.6%. Accommodation and Food Services, which again was hit especially hard by the pandemic, is another industry with similar prevalence in both regions – 9.9% and 9.2% in Northeast and Northwest, respectively. This industry experienced significant employment losses in both regions. And while in Northeast the loss of 43.2% was about four percentage points greater, Northwest’s Accommodation and Food Services losses accounted for a larger share of the total number of jobs lost – 35.1% to 30.6%.
Other than in Construction, the most divergent outcomes in terms of annual percent employment change occurred in Mining, for which employment was 30 times more concentrated in the Northeast region. While Mining employment actually grew in Northwest, a larger than average loss of employment in Northeast meant that the regions diverged significantly. Real Estate, Rental and Leasing, and Administrative Support and Waste Management Services were the industries with the next most divergent outcomes in terms of annual percent employment change. In both cases, Northwest fared much better (see Table 2).
Statewide, Agriculture, Forestry, Fishing and Hunting was the only industry to add jobs over the year, indicating relative insulation from effects of the pandemic. Agriculture, Forestry, Fishing and Hunting accounted for more than five times the share of regional employment in Northwest and increased by 0.8%, while in Northeast, the relatively smaller Agriculture industry declined 6.6%.
Lastly, with a statewide employment loss of 1.3%, Finance and Insurance was also less impacted than other industries. While the industry declined by a similar percentage in the Northwest region, the losses in Northeast were almost 8 times greater, meaning the Arrowhead missed out on the insulation provided by those less impacted industries.
Another way to examine varying impacts across the two regions is to use quarterly change. Seasonality tends to play a larger role in industries impacted by the weather or climate, such as natural resource-based activities, tourism-related industries, and most obviously, Construction. Seasonal factors can be used to explain some of the differences in employment loss for other industries as well.
By averaging the employment change from the first quarter to the second quarter over the past five years, we can get a baseline, typical seasonal change from winter into spring and summer. In turn, this five-year average can be used to estimate the expected employment in each of the regions in quarter two had the pandemic not occurred. In other words, we can evaluate how far from typical employment each industry was in the second quarter of 2020 and whether that varied by region. The larger the gap between the blue (2015-2019 average) and orange (2020) lines in Figures 3 and 4, the further an industry was from its typical employment change between quarters one and two.
Based on the previous five years, strong employment growth is the typical trend from the first to second quarter. Northeast averaged a 3.6% quarterly gain while the Northwest region typically saw an employment increase of 5.8%. In terms of actual jobs, this equaled and average of 4,970 and 12,386 additional jobs respectively for each region. Despite overall employment loss, Northwest industries were much closer to reaching their typical employment in the second quarter than those in Northeast. A difference of -21,280 jobs from the five-year average in Northeast was less than the -26,192 in Northwest, however relative to the overall employment in each region, the magnitude of this discrepancy was much greater for Northeast.
Further, we can compare the magnitude of these differences in individual industries. In this case, the largest relative difference can be found in Mining, an industry much more prevalent in Northeast. The typical first to second quarter employment change for Mining in Northeast is 1.7%, or 52 added jobs. The -18.1% quarterly employment change in 2020 however, was not the most different from the industry 5-year average. That title lay with Arts, Entertainment, and Recreation and Accommodation and Food Services, which both saw employment losses in excess of 36% (see Figure 4). The losses in Mining however were the most different when compared to a difference of 22.5 percentage points from a Mining industry that slightly outpaced its own five-year average in Northwest.
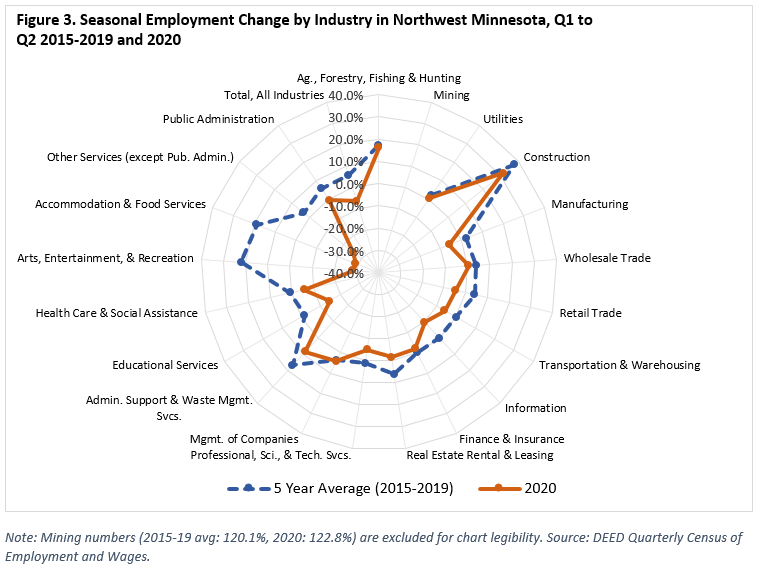
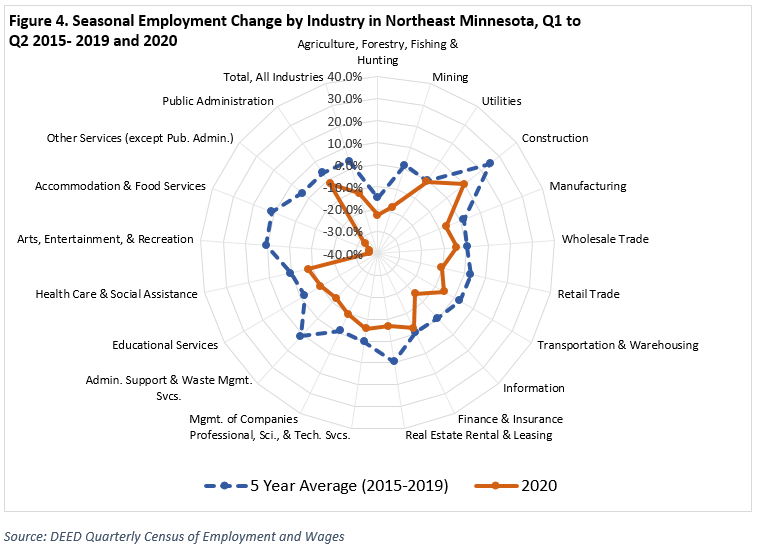
The gap between the typical and observed employment change is perhaps best illustrated by the two Leisure and Hospitality industries. Accommodation and Food Service and Arts, Entertainment and Recreation typically see the biggest boost in employment into the second quarter – sporting a five-year average of over 10% growth in Northeast and over 20% in Northwest. However, the effects of the pandemic instead made them the two industries with the largest employment losses in both regions, resulting in a massive employment change disparity. In both regions the employment change in quarter two for the Leisure and Hospitality sector was nearly 50 percentage points lower than the previous five-year average.
Construction is another industry that typically sees large employment increases from the winter into the spring and summer. Northwest did not see a significant deviation from the previous five-year average. Northeast, despite a lower typical quarterly change of 25%, saw an employment change in 2020 that was 15 points lower. Agriculture, Forestry, Fishing, and Hunting was similar in that the typical seasonal growth was larger in the Northwest region and was only slightly off in 2020. Not only was the five-year average of employment change lower in the Northeast region, but it was even further off in quarter two of 2020. Interestingly, the regions also differed in the directionality of the seasonal change in the Agriculture, Forestry, Fishing, and Hunting industry. Northwest’s five-year average was positive while the smaller industry in Northeast typically declined almost 15% from Q1 to Q2.
In Northeast, the industries that saw the largest differences from their expected Q1-Q2 employment change were Accommodation and Food Services, Arts, Entertainment, and Recreation, Other Services, Administrative Support and Waste Management, and Mining. Of those five industries, the top three were the same in Northwest, but then were followed by Educational Services and Information. Much like the annual percent change, the losses in Northeast industries were almost uniformly larger, with the only exceptions being Transportation and Warehousing and Educational Services.
Since these most recent employment data are from the second quarter, this only provides a picture of the initial impacts on each region. We know from other sources that since the second quarter, many jobs have been gained back in both regions and in many industries. Third quarter data from QCEW will bring the initial trajectories of each region’s recovery into better focus. For now, we know that the pandemic has, to differing degrees, negatively impacted Minnesota’s regional economies.
Though similar in many ways, Northeast suffered more severe employment losses due to a confluence of factors, often losing jobs at a greater rate than the state average. Higher concentrations of employment in Leisure and Hospitality, Other Services, Administrative Support, and Mining left Northeast more vulnerable. In Northwest, higher concentrations of industries that were less impacted, such as Manufacturing and Agriculture, helped to insulate it from deeper declines. In addition, industries more dependent on seasonal employment cycles performed better in Northwest. However, uncertainty remains in both regions as they work toward recovery.