by Amanda Rohrer and Oriane Casale
June 2013
A DEED analysis examines what happened to hundreds of workers who lost their jobs when the Ford assembly plant closed in St. Paul's Highland neighborhood.
The Twin Cities Ford Plant (TCFP) provided relatively well paid work for both high- and low-skilled workers in the region for more than 80 years. In April 2006, however, about 2,000 workers learned that the plant would close. Buyouts were finalized for 1,600 of the 1,750 line workers at the plant in November 2006, although it took several more years before the plant's doors finally closed in December 2011.1
To find out what happened to those workers, we tracked the employment and wage outcomes of people who were employed at the Ford plant during the second quarter of 2005, examining data through the second quarter of 2012, almost one year after the final closing of the plant.
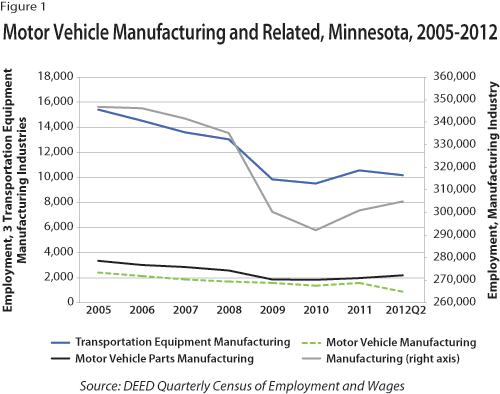
Looking at the aggregate industry data belies the magnitude of the TCFP layoff for those directly impacted. Figure 1 shows, for example, only a small dip in employment in motor vehicle manufacturing in Minnesota between 2006 and 2007. This is mostly due to a leveling effect of hiring increases at other companies in this industry over the same period. Moreover, manufacturing employment as well as subsectors like transportation equipment manufacturing fell so dramatically during the Great Recession that it overshadows the 1,600 or so workers who were let go before the final plant closing.

The TCFP shutdown coinciding with the Great Recession was terrible timing for the workers who lost their jobs. After layoff, they faced a declining labor market, particularly in manufacturing, followed by the worst labor market in 70 years. Although the recession did not officially start until December 2007, manufacturing began losing jobs over the year in December 2005. Meanwhile, total nonfarm jobs were almost flat throughout 2007, showing only 0.5 percent growth over that year, before starting to slide backward in May 2008. Moreover, the economy did not improve quickly like in most previous recessions. Manufacturing began adding jobs the same month as the economy as a whole began to recover, but that was not until August 2010.
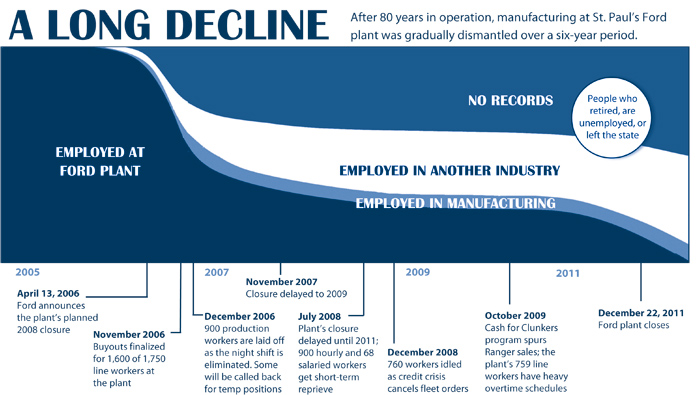
The timeline on the next page depicts employment outcomes for the study group through the closing of the plant over a six-year period.2 As the timeline shows, the second shift was eliminated at the end of 2006 and buyout applications were accepted. The initial shutdown date, however, was extended from 2008 to 2009, and finally to the end of 2011 due to continued demand for Ford Ranger trucks, which were manufactured at the plant.

Although re-employment was likely the goal for the majority of TCFP workers, most were eligible for a number of negotiated and public benefits to support them through the transition. Ford offered a selection of buyout options. About 1,600 of the 1,750 production workers employed at that time applied for these buyouts.3 Most TCFP workers were also eligible for DEED's Dislocated Worker Program, which provides intensive career counseling and, when appropriate, training and education benefits. In addition, some TCFP workers were also eligible for the Trade Adjustment Assistance (TAA) Program, which offers extended unemployment insurance benefits on top of training and education benefits. The Dislocated Worker Program served about 1,300 TCFP participants over the course of the shutdown, including more than 900 from our study group.4
As the timeline shows, many workers were able to extend their employment at TCFP well past the initial closing date of November 2006. Between 2007 and 2012, 55 percent of the workers employed at the plant during second quarter 2005 were employed there again for at least one quarter sometime after November 2006. In second quarter 2007, TCFP was still the primary job (meaning the largest share of their wage record earnings were from Ford) for almost half of the workers who were employed there in second quarter 2005. The numbers dwindled to about 25 percent in second quarter 2009 and to 20 percent by second quarter 2011.
Many other workers moved to other companies both in and outside of manufacturing. By second quarter 2007, 22 percent of the 2005 workers had primary jobs other than at TCFP. That number increased to 35 percent by second quarter 2009 and 36 percent by second quarter 2011, remaining at that level in second quarter 2012. As the timeline shows, less than half of this group was employed in the manufacturing sector. By second quarter 2012, only about 28 percent of those employed in Minnesota were working in manufacturing. We will explore this shift later in the article.
The remainder of our study group does not appear in Minnesota wage records at all after the initial 2007 shutdown was announced, including 29 percent in second quarter 2007, 41 percent in second quarter 2009, 42 percent in second quarter 2011 and 62 percent by second quarter 2012. The majority of these workers likely have retired. In fact, we know that 650 workers from TCFP activated UAW pensions between November 2006 and April 2013.5
Ten percent of the study group was still reported as drawing pay at TCFP in second quarter 2012. Although they are considered unemployed in our analysis because they were reported to have worked zero hours and have wages from no other firm, the terms under which they ended their employment with TCFP may have enabled them to be more selective about employment opportunities. Assuming no overlap between those drawing pay from the TCFP and those who have retired, this leaves about 19 percent of the former TCFP workers as yet unaccounted for in second quarter 2012.
Some of these remaining 19 percent may have been eligible to retire through managerial or other non-UAW plans. Others may have left Minnesota in hope of securing a job at a Ford plant in another state, although news reports and program statistics from the time of the layoff suggest that few had that option.6 Some workers left Minnesota for jobs, but it is impossible to know how many.
Including both Dislocated Worker and education records, about 15 percent of our missing workers pursued some kind of formal education after Ford. In total, almost 12 percent enrolled in a college certificate or degree program; the others received occupational skills training. Some of these workers are likely pursuing education full time rather than seeking work. However, this still leaves a substantial number of workers who might have been unemployed as of second quarter 2012.
In summary, although it is impossible to know exactly how many people in our study group were officially unemployed (actively seeking work) in 2012, a conservative estimate would put the number at about 19 percent. Of these, many likely would have joined the ranks of the long-term unemployed by 2012.
Reportedly, one of the more lucrative buyout options offered at least 50 percent of salary, health insurance and $15,000 per year for qualified educational programs for up to four years.7 Moreover, the Dislocated Worker Program provides excellent education and training benefits. Of the more than 900 TCFP workers enrolled in the Dislocated Worker Program, 48 percent had a high school diploma or less, 45 percent had some college or an associate degree, and only 6.7 percent had a bachelor's degree or higher. Although many of the workers at TCFP had long tenure, the workers who enrolled in the Dislocated Worker Program were relatively young. At time of entry to the program, the median age of workers was 48; today, the median for those workers is 51. With many more years of work in front of them, many workers came to the same conclusion: Going to school to receive training in a different field was their best option.
In this section we focus only on the 12 percent of our study group who enrolled in post-secondary institutions, including technical and academic degree programs, regardless of whether it was with the help of the Dislocated Worker Program, a buyout, or just on their own. About 40 percent of this group enrolled for at least one semester in one of six programs. Liberal arts (an associate degree program that is generally meant to precede enrollment in a B.A. program), business, nursing, HVAC, and truck or bus driving were the top five programs by enrollment. Another 269 enrolled in post-secondary education or training but did not declare a major at that time. Educational outcome data available in the future will shed more light on the programs that these workers pursued.
Employment outcomes for workers with recent post-secondary enrollment were better than for those without (see Table 1). Overall, 54.1 percent of those with post-secondary enrollment at some point during the six years were employed in second quarter 2012, compared with only 33.7 percent of those who had not attended a post-secondary educational institution.
| Employment and Wage Outcomes by Education for Former Ford Plant Workers | ||
|---|---|---|
| Enrolled | Not Enrolled | |
| Employed in Minnesota in 2012 | 32.5% | 67.5% |
| Median Wage Change | -22.7% | -31.9% |
| Not Employed in Minnesota in 2012 | 17.2% | 82.8% |
| Percent Employed | 54.1% | 33.7% |
| *Wages were dropped from the calculation if the hourly wage was over $100 or under $7.25 because they were likely incorrect.Source: DEED analysis using the Workforce Data Quality Initiative database | ||
There is, however, a major source of bias in this analysis. Since we are not able to isolate those 650 workers who enrolled in the pension program after November 2006, and since this group was unlikely to enroll in post-secondary education, they are included in this analysis and thus bring down the rate of employment for the not-enrolled group. For this reason, wage change may be a more accurate measure of the effects of post-secondary education. We examine this in the next section.
By second quarter 2012, 8.4 percent of former TCFP workers were employed in manufacturing (not including those still at TCFP) and another 27.8 percent were employed in another industry as their primary job. Table 2 tracks wage changes for workers in the study group who were employed somewhere other than TCFP during second quarter 2012.
| Wage Changes by Industry, 2005 to 2012 | ||
|---|---|---|
| Industry of Primary Job | Percent Change 2005 to 2012 | |
| Average Wage | Median Wage | |
| Manufacturing | -9.2 | -14.9 |
| Other | -25.4 | -34.4 |
|
*Wages were dropped from the calculation if the hourly wage was over $100 or under $7.25 because they were likely incorrect. In all, wages for 16 workers were dropped in the "other" category and wages for 12 workers were dropped in the "manufacturing" category in 2012. Source: DEED analysis using Unemployment Insurance wage records |
||
Overall, workers at the low end of the wage scale saw a decrease in their wages as shown by lower median wages in both manufacturing and other industries. Workers at the higher end of the wage scale retained much of their earning power if they were able to find a job in manufacturing.8
Moreover, across all industries, workers who enrolled in post-secondary education programs saw less decrease in their median wage (down 22.7 percent) compared with workers who did not enroll (down 31.9 percent).
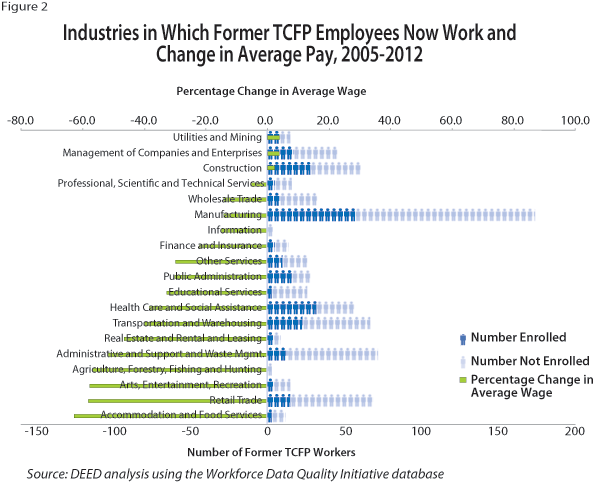
Overall, wage outcomes were worse for workers who found re-employment in an industry other than manufacturing, although a few industries had better wage outcomes for workers. Workers who found jobs in utilities and mining; management of companies and enterprises; construction; professional, scientific and technical services; or wholesale trade fared well. In all other industries, workers saw substantial decreases in average wages after leaving TCFP (see Figure 2).

Figure 2 also shows the total percent of workers in each industry as well as the percent enrolled in post-secondary education.9 The wages of workers who enrolled in post-secondary education may not yet reflect the entire benefit of that education. In many professions, education will get an applicant's foot in the door but wage gains will be realized only with experience.
Outcome measures for former TCFP workers show a decline in employment and earnings. Overall, about 19 percent of workers are likely still looking for work. For those who have found work, most have experienced wage decreases. It is important, however, to set this in context. When these workers finally lost their jobs at the plant - most between 2007 and 2009 - they found themselves facing the most difficult labor market since the Great Depression. Moreover, many returned to school and likely have not yet realized the full value of their educations. For those reasons, it will be important to continue to track this group of dislocated workers to see if wage outcomes improve over time.
Thanks to the staff of the Minnesota Dislocated Worker Program for help and support with this article.
Data and MethodologyWe used all available data sources for this article, including unemployment insurance (UI) wage records, which cover about 97 percent of employed Minnesotans. We also used Dislocated Worker (DW) Program records, with most Ford plant workers qualifying for the program and about half enrolling. We used the newly constructed Workforce Data Quality Initiative (WDQI) database to identify workers who enrolled in post-secondary education and training. Finally, we obtained data from the United Auto Workers (UAW) pension fund to find out how many workers have accessed pensions since November 2006. Unfortunately, complete data to track the outcomes of laid off workers are not available. For example, we do not know how many non-UAW-covered workers retired once their employment ended. We also do not know how many workers took jobs in another state. Finally, wage records data are unedited, which impacts the calculation of wage outcomes. We were forced to drop wage data that were clearly incorrect, but we were unable to identify with certainty all the wages that should have been dropped. Company- and individual-specific data are challenging to use for this type of research. While a variety of information is collected, it can be released only in aggregate form to protect the privacy of both the firm and person. To that end, we can't release total employment at the TCFP for any time period. This limits some of the ways we would normally display data. Tables, direct percentages, or numbers of workers may be difficult to compare - and that's by design. Our methodology was as follows: We selected all people employed at TCFP in second quarter of 2005 (the study group) and followed their employment in the UI wage records (employer, hours worked, wages earned by quarter) by Social Security number during the second quarters of 2007, 2009, 2011 and 2012. We also used that same pool of people, as identified by Social Security numbers, to determine participation in the Dislocated Worker Program, which gave us age and work or education status for a subset of the workers. Enrollment in post-secondary college including school and major came from the WDQI database. Because we were following a specific set of individuals, this article does not look at the temporary workers who may have been hired after 2006 or at total employment at the firm. |
1Welbes, John. "Ford's Final Night Shift Nears - Some May Come Back as Temps," St. Paul Pioneer Press, Dec. 13, 2006.
2All events described in the graphic come from the news reports cited below:
Welbes, John. "Ford's Final Night Shift Nears - Some May Come Back as Temps," St. Paul Pioneer Press. Dec 13, 2006.
Welbes, John. "Ford Plant Closing Delayed 1 Year - Car Maker, UAW Tentatively Agree to Keep St. Paul Operation Going into '09," St. Paul Pioneer Press. Nov 6, 2007.
Welbes, John and Nicole Garrison-Sprenger. "2 More Years - St. Paul's Ford Plant and its 968 Employees Stay at Work until 2011," St. Paul Pioneer Press. July 25, 2008.
Sitaramiah, Gita. "Ford to Idle Ranger Plant for December - Automaker Lost Fleet Orders for the Small Pickups because of Credit Squeeze, Union Rep Says," St. Paul Pioneer Press. Oct. 17, 2008.
Sitaramiah, Gita. "Ford Plant to Boost Ranger Production - Union: St Paul Factory to Begin OT Shifts in September," St. Paul Pioneer Press. Aug. 14, 2009.
3Welbes, John. "End of the Line for Many St. Paul Ford Workers," St Paul Pioneer Press, Dec. 13, 2006.
4When the Dislocated Worker Program declares a mass layoff event, eligible workers who lose jobs or earnings include recent hires or workers at other impacted firms such as suppliers or transportation companies. As a result, many of the workers who claimed benefits in the Dislocated Worker Program and two TAA-certified events declared during TCFP's six year decline were not necessarily TCFP employees and were therefore not in our study group.
5Reports state that half of Ford workers nationwide were eligible for retirement at the time the closure was announced. Data from the Dislocated Worker Program and the union pension system, however, indicate a younger workforce at the Twin Cities plant.
6Welbes, John. "Ford Workers Seek New Opportunities - One Veteran Workers is Pulling up Roots and Heading to Kansas City Assembly Plant." St. Paul Pioneer Press, June 3, 2007.
7McCartney, Jim. "Ford Presents Buyout Offers - St. Paul Plant's Workers get 8 Plans to Choose From," St. Paul Pioneer Press, Oct. 18, 2006.
8Note wage changes are not adjusted for inflation.
9Based on WDQI records.