by Dave Senf
May 2019
Note: All data except for Minnesota’s PMI have been seasonally adjusted. See the feature article in the Minnesota Employment Review, May 2010, for more information on the Minnesota Index.
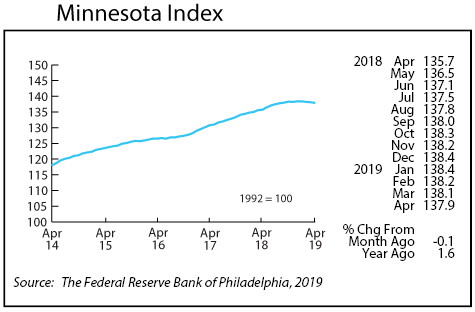
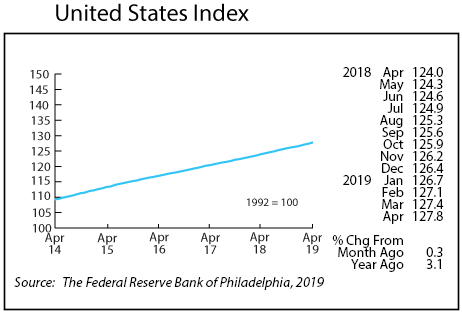
The Minnesota Index dipped for the fourth straight month in April, slipping to 137.9. The index peaked last December at 138.4. Despite wage and salary employment’s recording its largest monthly gain of the year and average weekly manufacturing hours jumping, the index still retreated as the unemployment rate rose by 0.1 percentage points for the fourth straight month. The Minnesota index declined by 0.1 percent while the U.S. index increased 0.3 percent in April.
April’s reading was up over the year by 1.6 percent for Minnesota and 3.1 percent for the U.S. The over-the-year gap between the two indices implies that over the last 12 months the U.S. economy has been expanding twice as fast as Minnesota’s economy. Minnesota’s index is down 0.4 percent since last December. Kansas, Hawaii, and Michigan are the only other states to show a drop in their indices since last December. Minnesota’s economy has slowed noticeably over the last six months. Whether the slowdown is related to labor shortages or other forces remains open to debate.
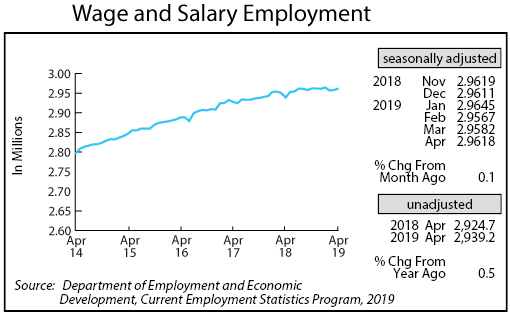
Minnesota’s adjusted Wage and Salary Employment jumped by 3,600 in April, topping January’s 3,400 job gain as the highest monthly job expansion so far in 2019. February’s loss of 7,800 jobs, however, means that Minnesota has added only 700 jobs since last December. February’s record snowfall probably played havoc with that month’s seasonally adjusted employment total. Most of the employment increases in April were private sector jobs as that sector added 2,900 positions while public sector positions climbed by 700. Manufacturing, along with Trade, Transportation, and Utilities, and Educational and Health Services had the strongest hiring in April. Job loss was highest in Leisure and Hospitality.
Unadjusted over-the-year job growth ticked up to 0.5 percent which is the highest over-the-year percent gain since last December. The gain is lower than the 0.7 percent average in 2018 and below the 1.8 percent rate for the U.S. in April. Minnesota’s seasonally adjusted wage and salary employment estimated increase so far in 2019 (change between December 2018 and April 2019) is only 0.02 percent. Only six other states have experienced lower job growth in 2019 than Minnesota. Five states – Montana, Iowa, Wisconsin, Connecticut, and North Dakota – are estimated to have lost seasonally adjusted wage and salary employment in 2019 through April.
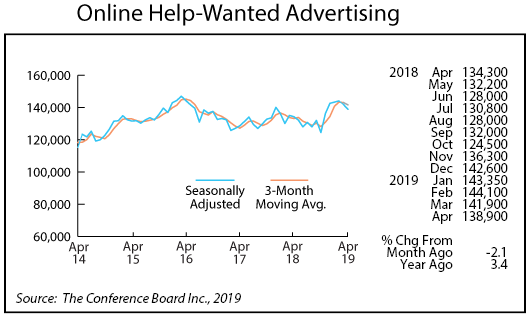
Online Help-Wanted Ads tailed-off for second month in a row in April falling to 138,900. That was the lowest total since last November, but job posting levels remain elevated by historic standards. Online postings fell 2.1 percent in Minnesota and 1.6 percent nationally. Minnesota’s share of online help-wanted ads slipped to 2.6 percent.
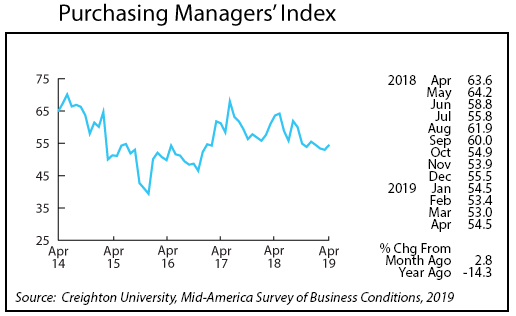
Minnesota’s Purchasing Managers’ Index (PMI) advanced for only the second time over the last eight months, inching up to 54.5. Both the comparable indices, the Mid-America Business Index and the national PMI, fell in April, retreating to 55.9 and 52.8 respectively. Minnesota’s reading has been basically flat since October 2018.
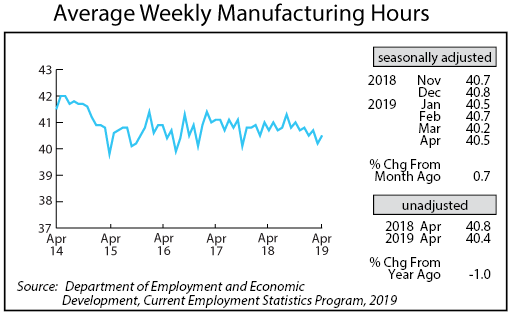
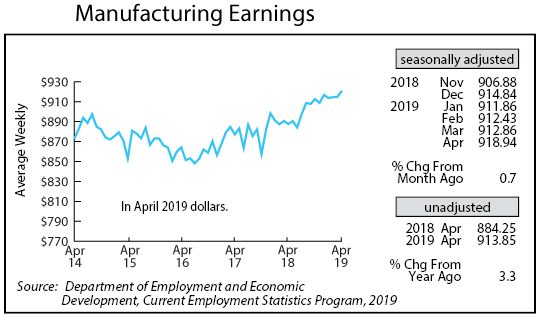
Adjusted average weekly Manufacturing Hours bounced back in April only part way from March’s decline, climbing to 40.5. On an unadjusted basis Manufacturing hours are down from 40.8 last April to 40.4 this year. The factory workweek has been getting shorter since last September which is consistent with the flatness of the PMI index. Despite the shorter workweek average weekly Manufacturing Earnings adjusted for inflation and seasonality rose to $918.94 in April, setting a record high in the 49-year series for the third straight month. Record high Manufacturing pay is consistent with manufacturers’ having a challenging time finding workers to hire. Real Manufacturing paychecks, before seasonal adjustment, have on average been 2.9 percent higher compared to the previous year during the last 12 months. In April real Manufacturing paychecks were up 3.3 percent from a year ago.
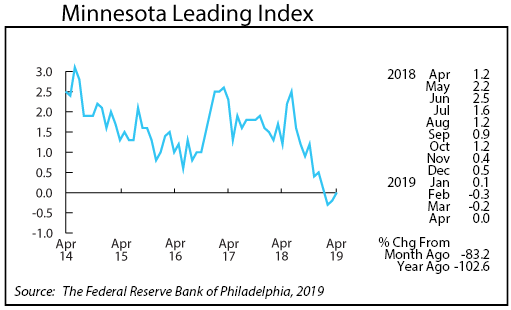
The Minnesota Leading Index inched up in April but remained below zero for the third straight month. The negative readings suggest that Minnesota’s economy will be contracting over the next six months. The U.S. leading index came in at 1.4, making April the ninth month in a row in which Minnesota’s leading index has trailed the U.S. index.
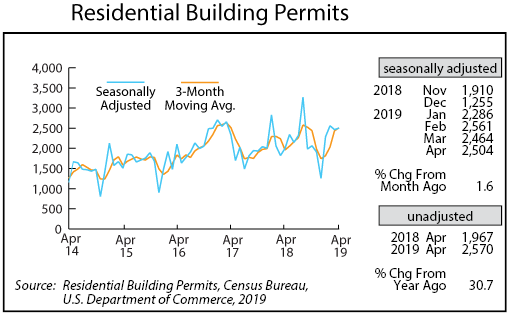
Once again adjusted Residential Building Permits were a bright spot among Minnesota monthly indicators. Home-building permits rose slightly to 2,504. On an unadjusted basis, home-building permits are up 18.3 percent from a year ago through the first four months.
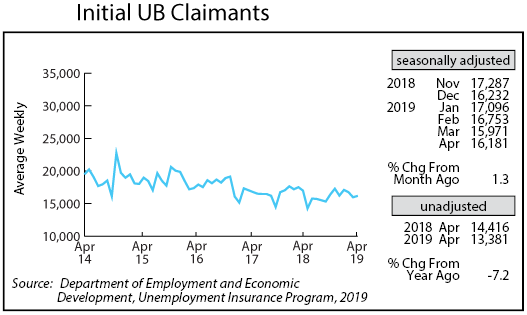
Adjusted Initial Claims for Unemployment Benefits (UB) ticked up in April to 16,181, continuing to run well below the 49-year monthly average of 21,630. Slow job growth can’t be traced to accelerating layoff rates given the low level of initial claims.