by Dave Senf
February 2021
One of the major tasks of the Labor Market Information Office of Minnesota's Department of Employment and Economic Development (DEED) is to inform Minnesotans about occupational employment. A lot of demand exists for information such as: how many Registered Nurses or Welders work in Minnesota? Wages for occupations is another popular topic. What's the average or median wage of Automotive Service Technicians and Mechanics in Warroad or Winona? Occupational projections, both short-term and long-term, also attracted plenty of interest, as do the education and training requirements for specific occupations.
Over half of the data tools that provide access to various Minnesota labor market data are occupation-focused with data reported across occupations rather than across industries. (Data tools.) The workhorse of occupational information is the Occupational Employment and Wage Statistics (OEWS) program. OEWS estimates are generated by surveying employers about which occupations their employees work in and what wages they receive. Since OEWS is an employer-based survey, only wage and salary employment is covered, leaving out self-employment. Occupational data for wage and salary employment and for self-employment are available from the Census Bureau's American Community Survey (ACS), which surveys individuals rather than employers about their occupations and earnings.
The two surveys have a few other significant differences which should be kept in mind when analyzing occupational employment and wage data. First, all wage and salary jobs held by multiple jobholders are captured in the OEWS data. Only the main job of individuals who hold multiple jobs, either wage and salary or self-employed jobs, are included in ACS data. Another difference is that OEWS is place-of-work based while ACS is place-of-residence based. The wage and salary job held by an individual who works in Fargo but lives in Minnesota would be counted in North Dakota's OEWS data but in Minnesota's ACS data. The third difference is that OEWS doesn't include certain industries (much of agriculture or railroads, for example) whereas all industries are included in ACS.

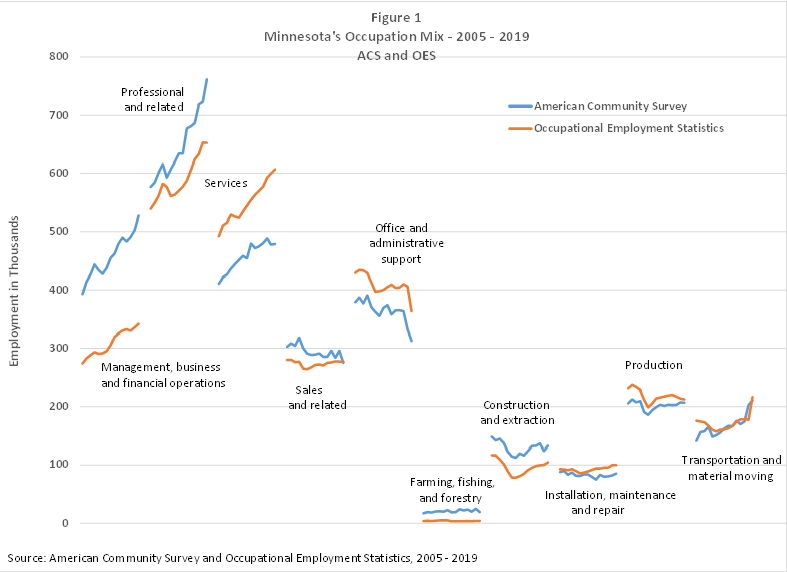
Minnesota's shifting occupational mix over the last two decades is displayed in Figure 1. The 800 plus occupations reported in OEWS and ACS have been aggregated to 10 major occupational groupings. Two takeaways standout in Figure 1. First there are major discrepancies in estimates in some of the occupational groupings. Many of the discrepancies can be traced to the self-employed. ACS reports 3,001,000 employment in 2019 while OEWS reports 2,881,000 employment, with the difference mainly being self-employment The source of discrepancy in some of the occupational groupings is part self-employed and part individuals classifying themselves into occupations differently than employers do when filling out the OEWS survey. (The recent uptick in transportation and material moving occupations and dip in office and administration support occupations is related to the transfer of stockers and order fillers out of the office and administration support group and into transportation and material moving group. The Standard Occupational Classification system is updated periodically, and changes over the years should be accounted for when exploring occupations over time.) The bottom line is that occupational employment estimates from OEWS and ACS have discrepancies that should be considered when analyzing occupational trends over time.
The other takeaway, despite the OEWS and ACS differences, is that most employment growth over the last two decades in Minnesota has been in management, business and financial operations, professional and related, and services occupations. Office and administrative support occupations have declined significantly while employment in all the other occupational groups has been for the most part flat. The shifting mix of occupations as displayed in Figure 1 generally aligns with what occupational projections have been predicting over the last 20 years.
As Minnesota's industrial mix of employment has shifted over the years, the state's occupational mix has also changed. Employment in goods-producing industries (agriculture, mining, construction, and manufacturing) decreased by 10% between 2001 and 2019, from 509,000 to 457,000 jobs. Employment in service-providing industries on the other hand have increased 17% over the same period, climbing from 2,160,000 to 2,520,000 jobs. (Based on Current Employment Statistics (CES) for 2001 and 2019.) Occupations in service-providing industries are primarily in occupational groups that have experienced expanding employment while occupations concentrated in goods-producing industries are mostly in occupational groups that have seen employment levels either stagnant or in decline.
Minnesota's shifting occupational mix is not breaking news. The state's occupational mix is continuously shifting as the economy evolves. A century ago Minnesota's economy was gradually moving from an agricultural-based to an industrial-based economy. Minnesota's economy, just like the national economy, is currently undergoing a long-running structural transformation from an industry-based economy to a knowledge-based economy. Keeping track of Minnesota's shifting occupational mix, especially relative to the U.S. occupational mix, is useful in judging how Minnesota's knowledge-based transition is going.
Minnesota's occupational mix is closer to the U.S. mix than most states as Minnesota had the 12th highest correlation with the U.S. occupational mix in 2019 using either OEWS or ACS. Illinois and North Carolina had occupational mixes most like the U.S. using ACS data, while Missouri and Texas were closest to the national mix using OEWS data. The occupational mix in Wyoming and Nevada differed the most from the national mix using ACS or OEWS data. The occupational mixes of Wyoming and Nevada differ the most from the national mix since their economies are much more highly dependent on energy production (Wyoming) and tourism (Nevada) than the national economy.
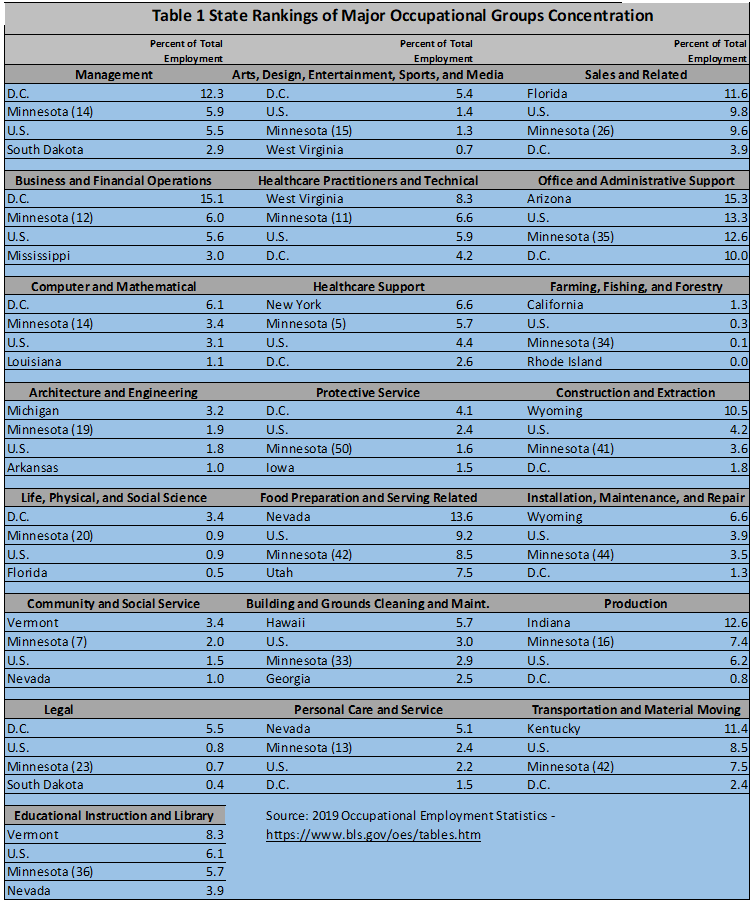
A slightly more detailed look at Minnesota's occupational mix relative to the U.S. is displayed in Table 1. Minnesota's share of total employment is compared to the U.S. and the top and bottom states for 22 major occupational groups using 2019 OEWS data. Minnesota's ranking for each group is also displayed. Healthcare support occupations in the state account for a larger share of total employment relative to the U.S. share than any of the other occupational groups. Healthcare Support occupations account for 5.7% of all employment in the state but only 4.4% of all U.S. employment.
The state also has high shares of production, healthcare practitioners, and technical, management, and computer occupational employment relative to the U.S. Minnesota has disproportionately less employment in transportation and material moving, protective service, food preparation and serving, and office and administrative support occupations.

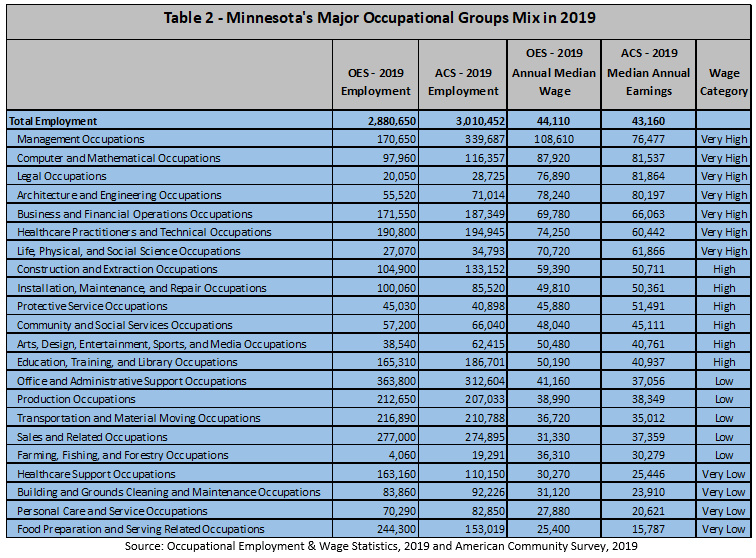
Insight into what kind of occupational opportunities are being created in Minnesota compared with the U.S. is provided by sorting the 22 occupational groups into four wage levels - very high, high, low, and very low - based on 2019 OEWS median annual wages and salaries and on tracking employment of the four wage groups over time relative to national growth. The wage group assignment for each occupational group is listed in the last column in Table 2. 2019 OEWS and ACS employment estimates and median earnings estimates from each survey are in the first four columns.

The trend among the four wage groups since 2001 is shown in Figure 2. Employment in very high wage occupations has been climbing in both Minnesota and nationwide, moving from around 20% of employment in Minnesota in 2001 to 25% in 2019. High wage employment as a percent of all employment has been flat over the two decades with a slight dip in Minnesota from 19% to 18% over the 18-year period.
Low wage employment in both Minnesota and the U.S. has tailed off, falling from 45% of all employment in 2001 to 37%. Very low wage occupations have increased their share of employment in Minnesota and nationally with very low wage occupation employment, expanding from 16% to 20%. This increase closely mirrors the national trend in very low wage occupation employment. The employment trend across the wage groups looks similar when ACS employment data replaces OEWS employment data.
The employment trends discussed above are consistent with a growing body of research showing that employment in very low and very high wage occupations has expanded at a faster clip than employment in middle wage (high and low wage) jobs in the U.S. (high and low wage). The shift has been going on for over three decades and appears to speed up during recessions when job loss is concentrated in middle wage occupations. The trend has come to be known as "job polarization" and has been pinpointed not only in the United States but across most other developed countries. The two most common explanations for why employment growth has been concentrated in high and low wage occupations are technological advancements and globalization. Another factor that receives less attention is the ongoing shift in the mix of goods and services demanded by consumers.
The job polarization trend has been interrupted during the Pandemic Recession and the ensuing uneven recovery over the last the nine months. Job loss during the pandemic recession was concentrated in the service-providing sector, unlike past recessions when job loss was concentrated in the goods-producing sector. Many of the service jobs lost this time around were in food preparation and serving occupations or personal care and service occupations. The occupations in these groups are predominately very low wage jobs. As the job rebound picks up speed through 2021, most - but not all - of those jobs are expected to be recovered.
There will be some long-term occupational shifts stemming from the COVID-19 pandemic, such as those related to the accelerated switch to online shopping. The magnitude of the changes from a long-term perspective will likely be moderate, slightly speeding up shifts that were in the long-term playbook already.