by Dave Senf
July 2022
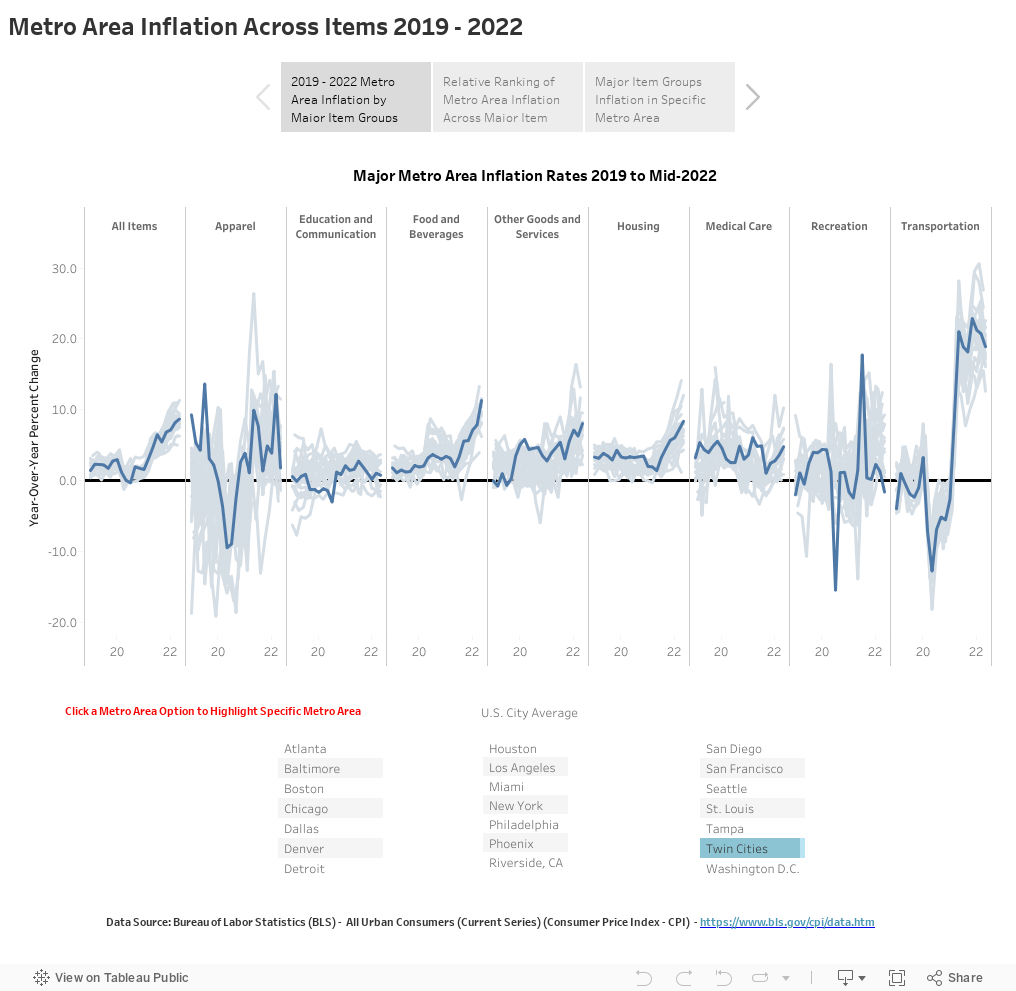
The Bureau of Labor Statistics (BLS) produces scores of Consumer Price Indices (CPI) covering not only the nation but regions and metro areas. CPI data for 21 major metro areas, including the Twin Cities, and the U.S. city average is used to calculated inflation rates explored in this visualization. CPI indices are available for a few metro areas monthly and for either even or odd months for the other metro areas.
The spike in inflation over the last year shows up in all metro areas with the highest overall inflation occurring in places like Tampa, Phoenix, Atlanta, and Miami. Higher relative housing inflation has fueled higher overall inflation rates in those metro areas. The 8.6 % inflation in the Twin Cities, which ranked as the 9th highest, was driven by relatively high inflation in food and beverages, housing, and medical care. Inflation Visualization.