by Dave Senf
April 2021
The plunge in employment in Minnesota and nationwide from the pandemic has been closely watched and analyzed over the last year. Less attention has been paid to income impacts related to the pandemic, especially the decline and rebound of income from paychecks. The summation of all workers paychecks, referred to here as wage and salary payments (W&S payments) made up more than 50% of Minnesota personal income in 2019 as measured by the Bureau of Economic Analysis (BEA)1. Two commonly used W&S payments sources are the Quarterly Census of Employment and Wages (QCEW) and Bureau of Economic Analysis (BEA).2
Another source of W&S payments, Current Employment Statistics (CES), requires a little multiplication, but provides estimated W&S payments with just a month lag. Private W&S payments are based on CES private monthly employment multiplied by average weekly earnings for all private employees multiplied by weeks in the month, which yields a monthly estimate of total private employees' W&S payments.3 The one-month lag in CES estimate of private W&S payments is handy as it provides quarter estimates one quarter ahead of corresponding BEA estimates and two quarters ahead of QCEW universe.
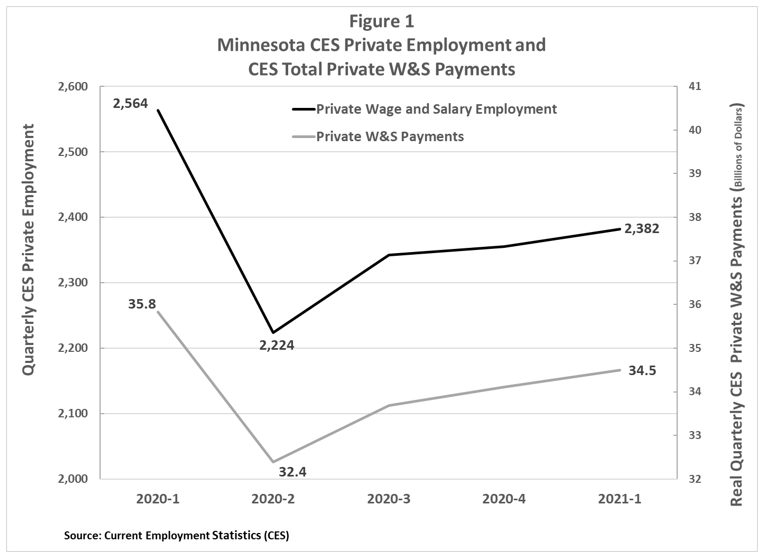
Most of the economic damage to Minnesota's job market from the pandemic occurred in the second quarter last year as private employment experienced a plunge of 13.3% from the first to the second quarter, while the drop off in private W&S payments was lower, declining 9.6% (see Figure 1). The W&S payments decline was smaller than the employment decline as job loss was concentrated in low-paying industries such as Restaurants, Other amusement and recreation, Traveler accommodation, and Personal care services.
All these industries involve close customer interface and bore the brunt of business shutdowns and lost customer bases. The 40 private industries with the lowest wages paid an average weekly wage of $432 in 2019 or less than half the $1,156 average weekly wage of all private jobs according to QCEW data. Jobs in the low paying industries are not only low-paying but disproportionately part-time jobs leading to paychecks 63% below the average private weekly paycheck in Minnesota in 2019.
Real private quarterly W&S payments have rebounded to $34.5 billion during the first quarter of 2021 or roughly 3.7% below the pre-pandemic level of $35.8 billion. Employment on the other hand is 7.1% below its level of a year ago as of the first quarter 2021.
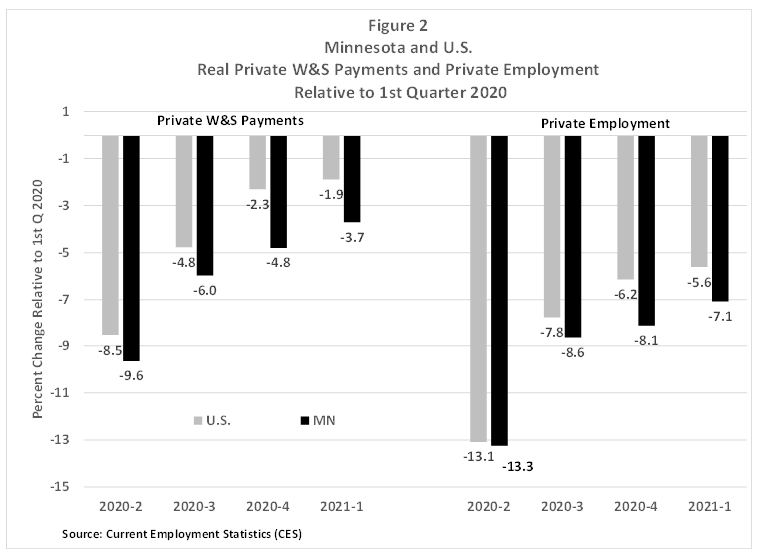
At the national level the private W&S payments and employment plunge during the second quarter of 2020 and ongoing bounce back looks very similar to what has occurred in Minnesota, except that the national decline was slightly smaller than Minnesota's decline while the recovery has been slightly faster. Private W&S payments fell 8.5% between the first and second quarters last year nationally while in Minnesota the decline was 9.6%. Real U.S. W&S payments during the first quarter of 2021 were 1.9% short of payments a year ago whereas Minnesota's shortfall relative to a year ago was 3.7% lower. Minnesota W&S recovery trails the U.S. primarily caused by the state's employment rebound lagging behind the U.S. (see Figure 2). Minnesota employment was 7.1% lower than a year ago in the first quarter of 2021 compared to the 5.6% over-the-year decline nationwide.
Minnesota's lagging employment rebound is shown more clearly in Figure 3 as Minnesota's share of private employment has been gradually slipping since 2012 but tailed off even more over the last three quarters from July 2020 to March 2021. Minnesota's job growth slipped noticeably below the national rate in 2018 and 2019 as the state's tighter-than-nationwide job market limited hiring in the state. The state's share of U.S. W&S payments has fared slightly better than employment share but has also dropped off since the pandemic arrived.
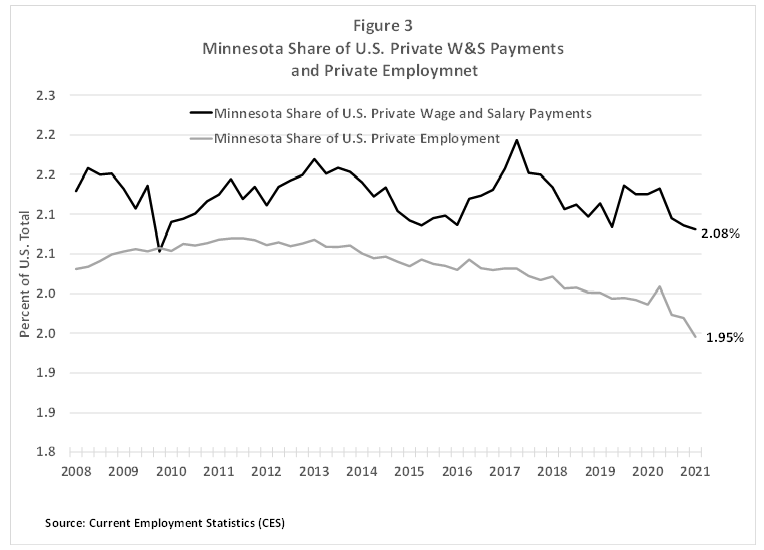
Minnesota's share of U.S. private W&S payments in the first quarter of 2021 stood at 2.08% compared to the 1.95% of share of national private employment. The share gap during the first quarter 2021 was 0.13 percentage points (2.08 minus 1.95) which is above the 0.09 percent share gap averaged between 2008 and 2021. Some may ask how the state's share of U.S. private W&S payments has been consistently above the state's share of U.S. private employment. The answer lies in how paychecks can get fatter or skinnier. Paychecks for many individuals are simply their hourly pay rate times hours worked. The CES survey, in addition to total employment, reports on just the above – average hourly earnings and average weekly hours across all private employment. Average weekly earnings are also reported and are just average hourly earnings multiplied by average weekly hours (see Figure 4).
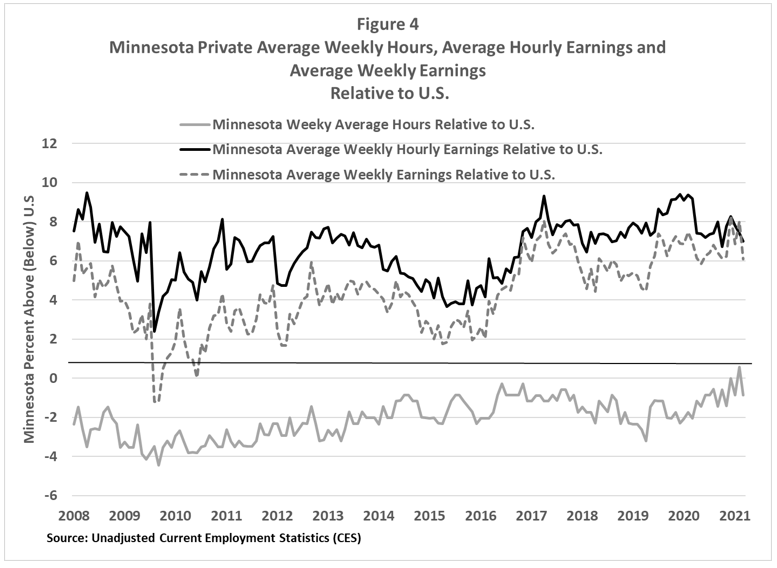
Minnesota private workers are paid more hourly on average than private workers nationwide but work fewer hours each week than the average U.S. private worker. The higher wages received by Minnesota private workers more than make up for lower number of hours worked leading to private sector average weekly earnings higher in Minnesota than nationwide. The average weekly earnings of private workers in the state was $1,110 ($57,700 annual) during the first quarter of 2021 or 7.0% higher than the $1,037 ($53,940 annual)) national average as reported by the CES survey.
Since last January average hourly earnings for Minnesota private sector employees relative to the U.S. private employees have slipped a tad while average weekly hours have steadily increased. The lower earnings and higher hours have been a wash when it comes to average weekly earnings. Over the last 12 months (April 2020 to March 2021) Minnesota average weekly earnings have averaged 6.6% above the U.S. average. The previous 12-month period (April 2019 to March 2020) averaged the same, 6.6% above the U.S. average weekly earnings.
All the data presented up to now have been generated by the monthly CES survey. The CES survey produces industry employment, hours, and earnings for the U.S., 50 states, and 250 Metropolitan Statistical Areas (MSA). The national employment estimate along with the U.S. unemployment rate are the two big numbers released monthly by the Bureau of Labor Statistics (BLS) that are closely scrutinized by Wall Street analysts on what has become known as Jobs Friday. The national sample consists of roughly 140,000 businesses and government agencies, covering 440,000 from a sampling frame of roughly 9.0 million Unemployment Insurance tax accounts. Minnesota's portion of the U.S. sample is 2,400 businesses and government agencies covering roughly 9,000 worksites from a population of roughly 178,000 Unemployment Insurance tax accounts.4
CES employment estimates for Minnesota are available back to 1950 but private hourly earnings and weekly hours are more limited having been first published in 2007. How does this relatively new W&S payments estimate compare to the two old standbys from BEA and QCEW? As Figure 5 displays, CES W&S significantly underestimates the collective income received by private sector employees in the form of wages and salaries. Despite this shortcoming, CES W&S payments are highly correlated with the other two W&S payments estimates, tracking the major up and down turnings points of the other two series.
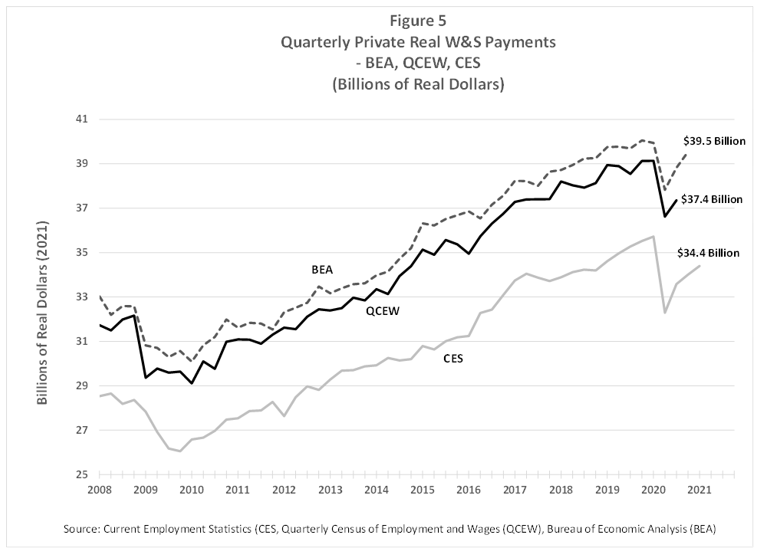
CES private W&S payments have averaged roughly 89% of private QCEW W&S payments in Minnesota since first published in 2007. QCEW W&S payments are consistently higher for several reasons but the overwhelming reason is the that QCEW includes work-related income not covered in the CES survey. CES wage and salary income includes overtime pay as well as tips, and commissions, and bonuses but only if earned and paid regularly. QCEW on the other hand includes irregular bonuses and more importantly includes gains from exercising stock options. CES estimates of hourly pay obviously miss out on a significant portion of work-related earnings in industries where year-end bonuses and pay in the form of stock options are commonplace.
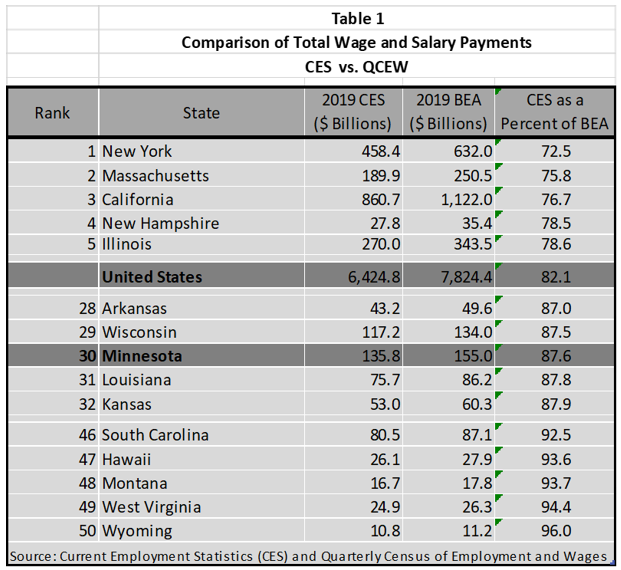
The variation in the ratio of annual CES and QCEW W&S payments among states underscores the difference in what is counted as work-related income in CES versus QCEW (see Table 1). CES W&S payments as a percent of QCEW W&S payments in 2019 ranged from 72.5% in New York to 96.0% in Wyoming. New York has a much higher concentration of employment in industries where total work-related earnings are paid in year-end bonuses or stock options (think Wall Street investment houses, commercial real estate firms, or high-tech startups) than Wyoming. CES W&S payments were 87.6% of QCEW W&S payments in Minnesota in 2019 which ranks near the middle of all states and is slighter higher than the 2019 nationwide ratio of 82.1%.
Keeping track of the direction of CES W&S payments each quarter provides a near real-time look at changes in Minnesota's private sector work-related income, but this measure doesn't tell the whole story since important private sector work payments are left out. The complete private W&S picture requires waiting a quarter or two when the more comprehensive OCEW and BEA W&S payment data are reported5. Minnesota's real private W&S payments have bounced back to 96.2% of pre-pandemic level (first quarter 2020) after having fallen to 90.3% of pre-pandemic level during the second quarter of 2020. That means that the state is more than halfway from recovering its private sector wage and salary income according to the CES survey.
1For more detail on Minnesota personal income components see "The Long Climb Back", Minnesota Economic Trends: 2013 September.
2QCEW data, BEA data, and CES data. All employment and W&S payments data presented here has been seasonally adjusted except for data used in Figure 4.
3The CES monthly survey provides average weekly earnings estimates for private employment only. Private W&S payments in 2019 accounted for 87.1% of all Minnesota W&S payments according to the BEA estimates.
4Minnesota CES data and methodology.
5BEA W&S payments are even higher than QCEW estimates since the BEA makes adjustments to QCEW numbers to account for employment and wages not covered or not fully covered by the state UI programs. Added to QCEW employment and wage and salary data for example are nonprofit organizations not participating in the UI program, elected officials and members of the judiciary (state and local government), private households services, private elementary and secondary schools, religious membership organizations, and railroads. The BEA also adjusts employment and wages upward to compensate for underreporting in the UI program.