by Erik White
January 2018
The construction industry in Northeast Minnesota is rebuilding from the aftermath of the housing bubble and recession of 2009 as employment has gained, and the number of hours worked has increased. A new barrier presents itself, however, as the labor market has tightened in the region, and an older and aging population pressures the labor force system with the need to replace workers who may soon retire. With any challenge comes opportunity, and the construction industry will be home to many of these in the region.
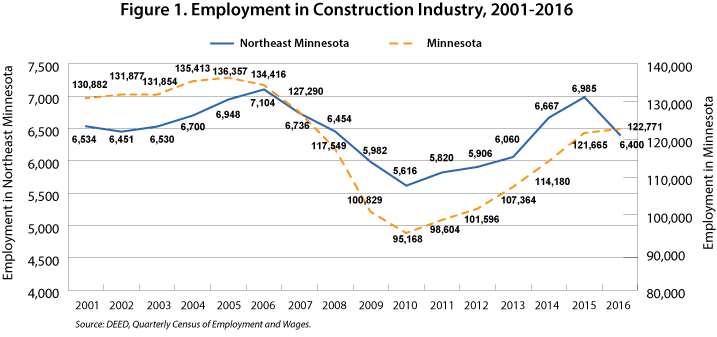
Employment in the construction industry bottomed out in 2010 with only 5,616 employed in Northeast Minnesota. This was a 20.9 percent drop of employment from 2006 when there were nearly 1,500 more workers in the industry. This precipitous drop reflects the severity of the recession in the construction industry but since the low-water mark of 2010, the industry has rebounded and nearly recovered all jobs lost in 2015 before a decrease in jobs the following year. In 2016 there were 6,400 people with covered employment in the construction industry in the 7-county Arrowhead region (see Figure 1).
Employment trends for construction in Northeast Minnesota follow the statewide industry direction with greater employment during the housing boom of the early 2000s followed by a sharp decline in employment with the housing bust and recession of 2009. But the region's construction employment declined by only 2.1 percent since 2001, compared to a 6.1 percent loss of construction jobs statewide during the same time frame. Despite annual statewide gains in construction jobs since 2010, the state of Minnesota is at only 90 percent of its pre-recession peak of employment with more than 13,500 more jobs needed to match. Northeast Minnesota nearly recovered all construction jobs lost to the recession in 2016 before a big decline in the past year (see Figure 1).

The drop in employment from 2015 to 2016 in Northeast Minnesota can be attributed to the completion of some major construction projects in the region. In Duluth the new 11-story downtown building was completed in the spring of 2016. On the Mesabi Range in Nashwauk, work restarted on the completion of a new iron-ore processing plant. This project had upwards of 800 construction workers at a given time in 2015, but because of financing issues, the processing plant is yet to be completed.
The construction industry only accounts for 4.5 percent of covered employment in the region but provides substantially higher wages with an average annual wage of $55,986, more than $14,000 more than the average salary in the region. The largest subsector of the construction industry is that of specialty trade contractors with more than 55 percent of employment of the overall construction sector.
The highest paying subsector is heavy and civil engineering construction, which provides an average annual wage of more than $70,000. This subsector has also seen its employment grow by nearly 25 percent since 2006 with an increase of nearly 300 jobs primarily from the highway, street, and bridge construction subsector.
While employment in the construction of building subsector is nearly evenly split between residential and non-residential, the latter has significantly better wages and has also experienced considerable growth in employment since 2006. Residential building construction, on the other hand, has lost 300 jobs since 2006, a 30 percent decline, and has average annual wages of $32,358. However, this subsector has gained over 100 jobs in the past five years, providing evidence of a recovering economy (see Table 1).
| Table 1. Northeast Minnesota Construction Industry Employment Statistics, 2016 | |||||||
|---|---|---|---|---|---|---|---|
| 2016 | 2011-2016 | 2006-2016 | |||||
| Number of Firms | Number of Employed | Average Annual Wage | Numeric Change | Percent Change | Numeric Change | Percent Change | |
| Total, All Industries | 8,454 | 141,802 | $41,755 | 3,979 | 2.9% | 165 | 0.1% |
| Construction | 906 | 6,400 | $55,986 | 580 | 10.0% | -704 | -9.9% |
| Construction of Buildings | 254 | 1,323 | $47,619 | 89 | 7.1% | -184 | -12.3% |
| Residential Building Construction | 229 | 692 | $32,358 | 108 | 18.3% | -300 | -30.3% |
| Nonresidential Building Construction | 26 | 631 | $64,332 | -19 | -2.9% | 116 | 22.5% |
| Heavy and Civil Engineering Construction | 73 | 1,498 | $72,730 | 276 | 22.6% | 295 | 24.5% |
| Utility System Construction | 23 | 328 | $79,768 | 19 | 6.1% | 52 | 18.8% |
| Highway, Street, and Bridge Construction | 40 | 1,036 | $71,552 | 254 | 32.5% | 172 | 19.9% |
| Specialty Trade Contractors | 579 | 3,579 | $52,071 | 215 | 6.4% | -814 | -18.5% |
| Foundation, Structure, Exterior Contractors | 118 | 945 | $51,636 | 31 | 3.4% | -57 | -5.7% |
| Building Equipment Contractors | 185 | 1,507 | $57,668 | 77 | 5.4% | -676 | -31.0% |
| Building Finishing Contractors | 92 | 448 | $47,632 | 135 | 43.1% | -25 | -5.3% |
| Other Specialty Trade Contractors | 183 | 679 | $42,068 | -27 | -3.8% | -55 | -7.5% |
| Source: DEED Quarterly Census of Employment and Wages (QCEW) | |||||||
Another way to analyze the construction industry is to measure the median hours worked per quarter. Ask any of Northeast Minnesota's construction workers, and they will tell you it's the number of hours on the job that determines the success of the season and with DEED's new data tool, Quarterly Employment Demographics (QED), we can do just that.
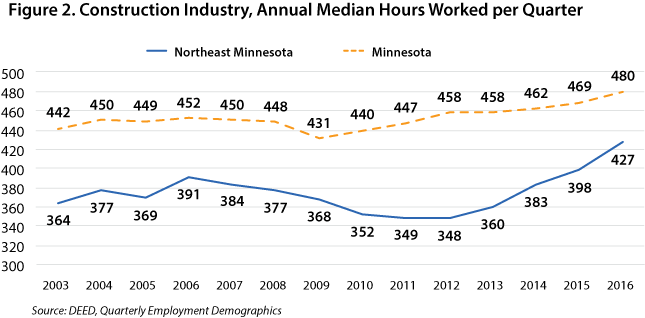
Not only did the number of construction jobs decrease, so did the number of hours available to those who kept their jobs. The annual median hours worked per quarter in Northeast Minnesota dropped to about 350 hours worked per quarter – the equivalent of about 27 hours per week – from 2010 to 2012 following the recession, down from a pre-recession peak of 391 hours worked per quarter in 2006. For 2016 the median hours worked per quarter jumped to 427, a 22 percent increase from the post-recession drought and a 36 hour increase from the pre-recession peak, indicating an industry being put back to work and workers receiving bigger paychecks (see Figure 2).

With a median wage of $27.26 for construction and extraction occupations in the region, an increase of six hours of work a week – the difference between 350 hours and 427 hours worked per quarter – is equal to an increase of $8,500 to paychecks over the course of an entire year.
Compared to the state overall, workers in Northeast Minnesota's construction industry still have fewer annual hours worked per quarter, however. After the 2009 recession, the difference in hours worked between the state and Northeast Minnesota was about 100 hours per quarter for 2011, 2012, and 2013. In 2016 the region's construction industry had narrowed the gap to 53 hours, still lagging behind (see Figure 2).
The northeast region had fewer hours worked per quarter than the five other planning areas in the state for every year of the QED database and had the biggest difference between the median hours worked in Quarter 1 and in Quarter 3 in any given year since 2003, signifying the effects winter has on this sector (see Table 2).
| Table 2. Construction Industry Statistics, 2016 Annual | ||||||
|---|---|---|---|---|---|---|
| Region | Northeast Minnesota | Central Minnesota | Northwest Minnesota | Southeast Minnesota | Southwest Minnesota | Seven County Mpls-St Paul, MN |
| Median Hours Per Quarter | 427 | 490 | 480 | 484 | 484 | 480 |
| Source: DEED's Quarterly Employment Demographics | ||||||
The future outlook of the construction industry suggests that there will be opportunities in this field moving forward. DEED's Employment Outlook data tool projects that the construction industry will grow by 2.1 percent in the next decade with an increase of nearly 140 jobs, which matches the projected growth rate of the overall economy in the region. The projected growth of the construction industry in Northeast Minnesota pales compared to the statewide construction employment growth rate of 9.5 percent, where the state is projected to increase over 10,000 new construction jobs in the next decade (see Table 3).
| Table 3. Northeast Minnesota Industry Employment Projections, 2014-2024 | |||||||
|---|---|---|---|---|---|---|---|
| NAICS Code | Industry | Estimated Employment 2014 | Projected Employment 2024 | Percent Change 2014-2024 | Numeric Change 2014-2024 | ||
| 0 | Total, All Industries | 159,860 | 163,078 | 2.0% | 3,218 | ||
| 23 | Construction | 6,468 | 6,606 | 2.1% | 138 | ||
| 236 | Construction of Buildings | 1,476 | 1,509 | 2.2% | 33 | ||
| 2361 | Residential Building Construction | 646 | 628 | -2.7% | -18 | ||
| 2362 | Nonresidential Building Construction | 830 | 881 | 6.1% | 51 | ||
| 237 | Heavy and Civil Engineering Construction | 1,134 | 1,070 | -5.6% | -64 | ||
| 2371 | Utility System Construction | 383 | 328 | -14.3% | -55 | ||
| 2373 | Hwy, Street, and Bridge Construction | 583 | 562 | -3.6% | -21 | ||
| 238 | Specialty Trade Contractors | 3,858 | 4,027 | 4.3% | 169 | ||
| 2381 | Building Foundation/Exterior Contractors | 1,033 | 1,105 | 6.9% | +72 | ||
| 2382 | Building Equipment Contractors | 1,666 | 1,717 | 3.0% | 51 | ||
| 2383 | Building Finishing Contractors | 379 | 335 | -11.6% | -44 | ||
| 2389 | Other Specialty Trade Contractors | 780 | 870 | 11.5% | 90 | ||
| Source: DEED Employment Outlook | |||||||
Unlike other regions of the state which have seen considerable population growth which has fueled the demand for construction, Northeast Minnesota's population has remained stable with less than 1 percent growth since 2000 and is projected to remain around 325,000 people into 2030. Much of the opportunity in the construction industry will come from replacing an aging workforce in the Arrowhead region.
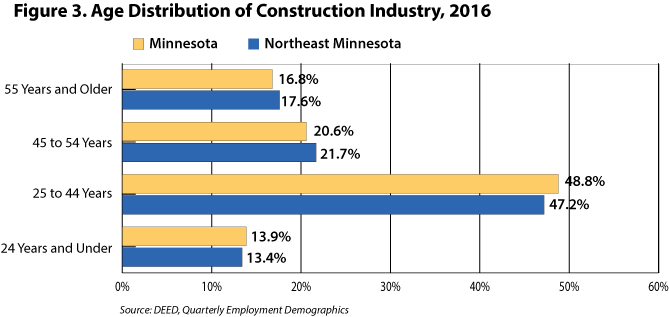
In Northeast Minnesota 17.6 percent of employment in the construction industry is 55 years and older, suggesting considerable hiring demand in the near future to replace those who will retire from the field. Interestingly, the percentage of older workers in the Arrowhead construction industry nearly matches the state's 16.8 percentage of 55 year and older workers, indicating an industry wide dilemma and not just a localized issue. Meanwhile, the percentage of workers who are 24 and younger in the industry hovers between 13 and 14 percent for the Northeast region and the state of Minnesota (see Figure 3).

Because of a stable population and an aging workforce in Northeast Minnesota, much of the opportunities for construction careers will come for replacing workers instead of adding additional jobs. In fact, of the 1,480 projected openings in construction and extraction occupations over the next decade, 1,310 of them will be replacement openings (see Table 4).
| Table 4. Northeast Minnesota Construction-Related Occupational Employment Projections, 2014-2024 | ||||||||
|---|---|---|---|---|---|---|---|---|
| SOC Code | Occupation | Median Hourly Wage | Estimated Employment 2014 | Projected Employment 2024 | Percent Change 2014-2024 | Numeric Change 2014-2024 | 2014-2024 Replacement Openings* | 2014-2024 Total Openings** |
| 0 | Total, All Occupations | $17.25 | 159,860 | 163,078 | 2.0% | 3,218 | 38,200 | 44,660 |
| 470000 | Construction and Extraction Occupations | $27.26 | 8,114 | 8,252 | 1.7% | 138 | 1,310 | 1,480 |
| 471011 | First-Line Supervisors of Construction Workers | $33.72 | 480 | 481 | 0.2% | 1 | 30 | 30 |
| 472021 | Brickmasons and Blockmasons | $30.59 | 103 | 122 | 18.4% | 19 | 20 | |
| 472031 | Carpenters | $24.37 | 1,313 | 1,326 | 0.9% | 13 | 150 | 160 |
| 472051 | Cement Masons and Concrete Finishers | $26.13 | 176 | 190 | 7.9% | 14 | 20 | 30 |
| 472061 | Construction Laborers | $22.83 | 1,127 | 1,170 | 3.8% | 43 | 220 | 260 |
| 472073 | Construction Equipment Operators | $33.46 | 1,120 | 1,134 | 1.2% | 14 | 180 | 200 |
| 472111 | Electricians | $32.12 | 863 | 872 | 1.0% | 9 | 130 | 140 |
| 472141 | Painters, Construction and Maintenance | $24.68 | 269 | 271 | 0.7% | 2 | 40 | 40 |
| 472151 | Pipelayers | $32.45 | 71 | 72 | 1.4% | 1 | 10 | |
| 472152 | Plumbers, Pipefitters, and Steamfitters | $33.66 | 416 | 417 | 0.2% | 1 | 50 | 50 |
| 472211 | Sheet Metal Workers | $29.85 | 284 | 287 | 1.0% | 3 | 60 | 60 |
| 473012 | Helpers--Carpenters | $17.99 | 51 | 53 | 3.9% | 2 | ||
| 474011 | Construction and Building Inspectors | $32.08 | 68 | 68 | 0.0% | 10 | 10 | |
| 474051 | Highway Maintenance Workers | $24.31 | 410 | 405 | -1.2% | -5 | 100 | 100 |
| 474071 | Septic Tank Svcs. and Sewer Pipe Cleaners | $17.62 | 91 | 98 | 7.6% | 7 | 20 | 20 |
| 475021 | Earth Drillers, Except Oil and Gas | $26.65 | 58 | 51 | -12.0% | -7 | 10 | 10 |
| *Replacement Openings: Net replacement openings is an estimate of the need for new work force entrants to replace workers who leave an occupation. It estimates the net movement of1) experienced workers who leave an occupation and start working in another occupation, stop working altogether, or leave the geographic area, minus2) experienced workers who move into such an opening. It thus does not represent the total number of jobs to be filled caused by the need to replace workers.** Total Openings: Total job openings represent the sum of employment increases and net replacements. If employment change is negative, job openings from growth are zero and total job openings equals net replacements. | ||||||||
| Source: DEED Employment Outlook | ||||||||
Local efforts to attract the next generation of construction workers include the annual Construct Tomorrow events which bring representatives from multiple trade organizations to a local site to provide hands-on experiences for regional high school students to connect and share opportunities in these fields. The local Northeast Minnesota workforce development boards (WDBs), which direct federal, state, and local funding to workforce development programs, have identified the construction industry in their regional plans, a requirement of the Workforce Innovation Opportunity Act (WIOA)-federal legislation that guides the activities of these local links to the public workforce system-for targeted development of sector strategies because of the opportunities that await in this high-pay, high-demand industry.
The WDBs have begun to reach out to the various trade organizations in the region to highlight the apprenticeships attainable and the application processes required of those eager to begin their journey into a career in the construction industry. Reaching out to under-represented populations, such as women and minorities, and attracting and welcoming immigrants may hold answers to forthcoming workforce challenges in this industry. In response the WDBs have initiated conversations with the various trade organizations in the region to highlight and disseminate the apprenticeship and application processes associated with entry into the trades. They have also applied to DEED's Minnesota Women and High-wage, High-Demand, Nontraditional Jobs Grant Program, a step in the right direction towards a more inclusive construction workforce in Northeast Minnesota.