
by Oriane Casale
September 2023
Minnesotans with disabilities age 16 and older make up about 12.9% of the total population but only 5.8% of the employed population. Nationwide, Americans with disabilities comprise 15.1% of the total population and 6.6% of the employed population. This article uses the American Community Survey data for 2017 to 2021 (5-year estimates) to document the labor force experience of Minnesotans with disabilities.
People with disabilities face many obstacles to working. Finding suitable work, convincing employers of their value as employees during the hiring process, commuting and transportation, are all significant barriers. In addition, obtaining the accommodations needed to perform their jobs, whether that is personal care assistance, job coaches, accessibility software and hardware or simply accessible facilities, can prove insurmountable for many people and may be exacerbated in certain geographic areas, industries, and labor markets.
Despite these obstacles, both Minnesotans and Americans with disabilities are a critical part of the workforce. In Minnesota, almost 158,000 people with disabilities are in the labor force and nationwide, 8.8 million.
The disabilities included in these statistics are self-reported based on a set of six survey questions in the American Community Survey. Each question asks if a person has difficulty with a specific action or function, which include the following:
Disability status per the American Community Survey is simply defined as having one or more of the difficulties listed above.
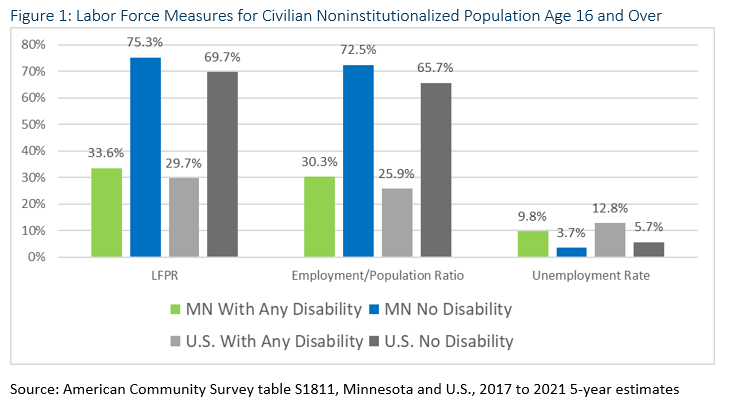
Figure 1 compares the basic labor force measures, including labor force participation, employment to population ratio and unemployment rate, for the civilian noninstitutionalized population age 16 and over with one or more disabilities and with no disabilities. The data represents the five-year period, 2017 to 2021 and comes from the American Community Survey.
People aged 16 and over with one or more disability had a labor force participation rate of 33.6% compared to 75.3% for those without disabilities in Minnesota. Both groups have higher labor force participation rates than nationwide which are at 29.7% for people with disabilities and 69.7% for those with no disability.
The employment to population ratio, which compares the share of people who are employed to the civilian non-institutionalized population age 16 and over, is 30.3% for people with one or more disabilities and 72.5% for people no disability in Minnesota. The comparable numbers nationally are 25.9% and 65.7%.
The unemployment rate is 9.8% for people with one or more disabilities and 3.7% for people with no disabilities in Minnesota. Nationwide the unemployment rate for people with one or more disabilities was 12.8% compared to 5.7% for people with no disabilities.
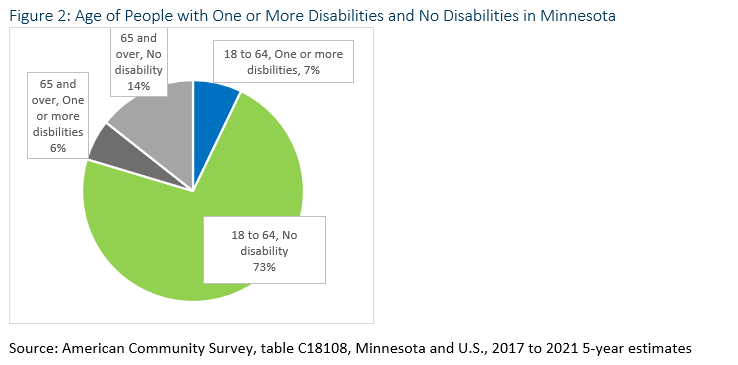
About 46% of people with one or more disabilities is over age 64 in Minnesota (see Figure 2), which is the age at which labor force participation drops for everyone. Figure 3 shows the same labor force measures as Figure 1 but for a subset of the population in Figure 1: noninstitutionalized people age 18 to 64. This provides a comparison of only those people in their prime working years.
Workers in their prime working years with one or more disabilities had a labor force participation rate of 53.5% compared to 86.9% for those without a disability in Minnesota. Both groups have higher labor force participation rates than nationwide which are at 44.2% for people with disabilities and 81.5% for those with no disability (see Figure 3).
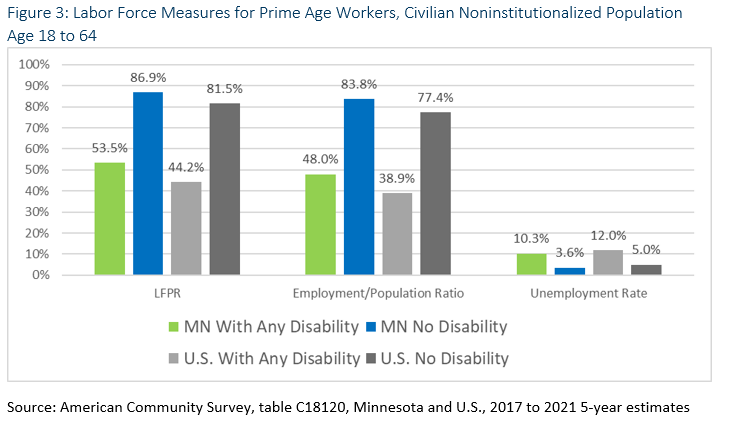
The employment to population ratio is 48.0% for people with one or more disabilities and 83.8% for people no disability in Minnesota. The comparable numbers nationally are 38.9% and 77.4%.
For workers of prime working age, the unemployment rate is 10.3% for people with one or more disabilities and 3.6% for people with no disabilities in Minnesota. Nationwide the unemployment rate for people with one or more disabilities was 12.0% compared to 5.0% for people with no disabilities.
The gap between people of prime working age with one or more disabilities and those with no disabilities is smaller in Minnesota for labor force participation and unemployment rate. This indicates that labor market-based disparities between people with disabilities and those without is smaller in Minnesota than nationally.
National data shows that the gap between the employment-to-population ratio for works with one or more disabilities and those with no disabilities has shrunk over time. Just prior to the Pandemic Recession, the gap was 43.1 points (74.8% for people with no disability compared to 31.7% for those with one or more disabilities). By August 2023, the gap was 37.3 points (75.2% compared to 37.9%). We do not have current data at the state level but will continue to track these trends as data becomes available.
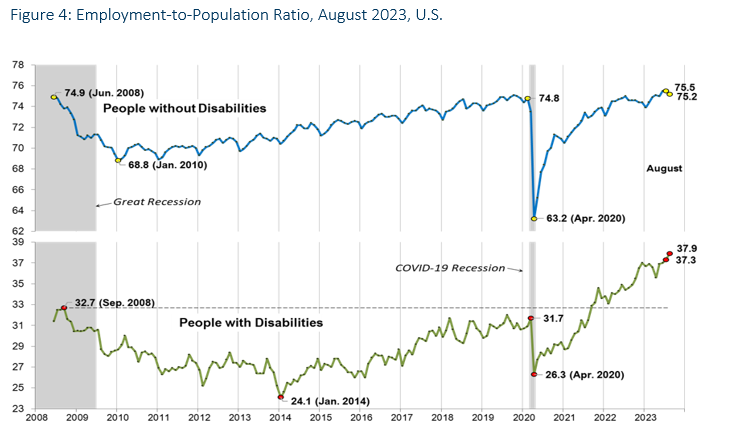
Source: Center for Research on Disabilities, nTIDE Lunch & Learn Webinar PowerPoint, September 1, 2023
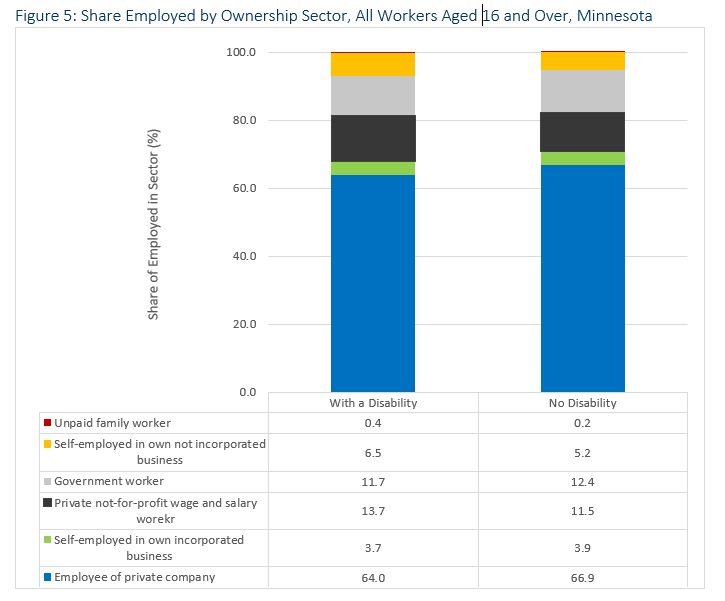
Workers with a disability are slightly more likely to work for themselves in a non-incorporated business, for a private non-profit organization or unpaid in a family business (workers who work for a family business, even if they are not paid, are considered employed) than workers with no disability in Minnesota. They are slightly less likely to work for a private company or in government (see Figure 4). Breaking out level of government employment, workers with one or more disability are more likely to work in the Federal Government, but less likely to work for state or local government.
By occupational group, workers with one or more disability are more likely to work in production, transportation and material moving, sales and office, and service occupations than workers with no disabilities. They are less likely to work in natural resources, construction and maintenance or management, business, science and arts occupations than their counterparts (see Figure 5).
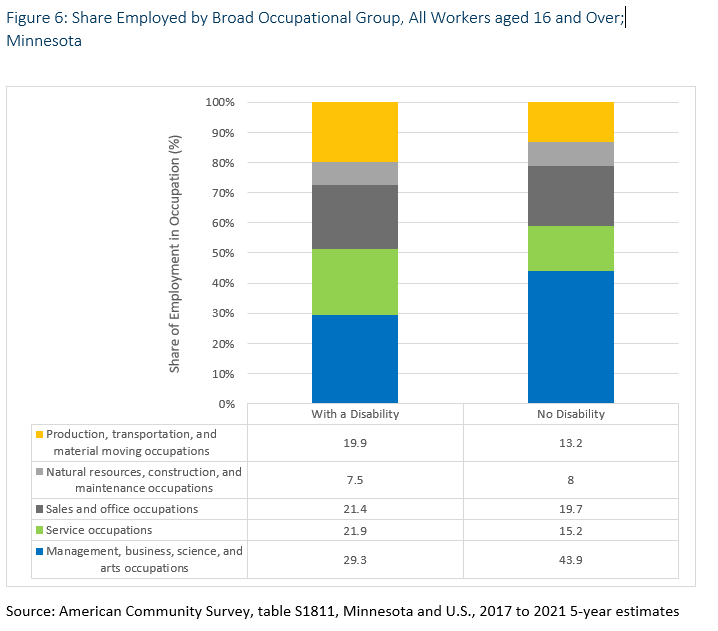
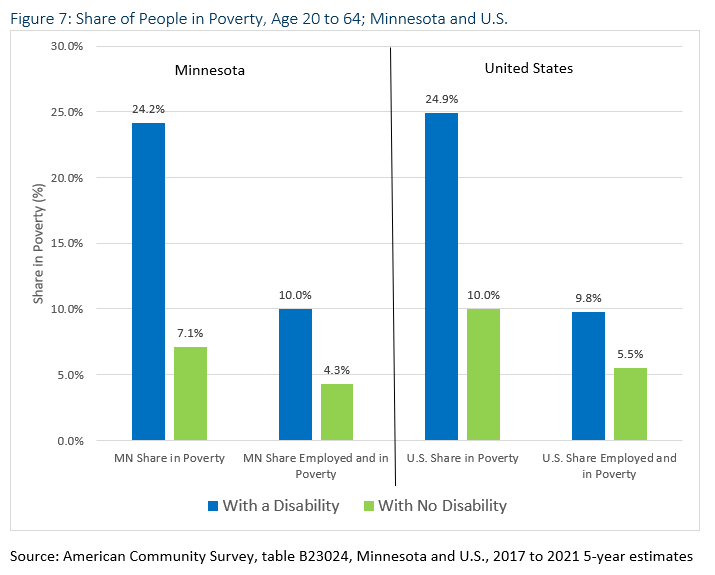
Figure 6 looks at the poverty status of people of prime working age with and without a disability and compares the total population in these categories with just those who are employed. As the graph shows, people with one or more disabilities are more than three times as likely to live in poverty as those without a disability in Minnesota. For employed workers, those with one or more disabilities are more than twice as likely to live in poverty as those without a disability.
Although overall Minnesota has a lower share of people in poverty than the U.S., on both measures — total and those who are employed — Minnesota has larger disparities between people with and without a disability than the United States. The difference between the share of Minnesotans in poverty with a disability compared to those without is 17.1 points compared to only 14.9 points nationwide. And for working Minnesotans living in poverty, the difference is 5.7 points compared to 4.2 nationwide. This provides a stark reminder of how economic opportunity is structured to exclude people with disabilities from fully participating in the prosperity of this state and nation and how little support, even in Minnesota, is available to offset that disparity.
Although overall Minnesota has greater disparities between labor force participation of people with and without a disability, when controlling for prime working age adults it is clear that Minnesota has better labor force outcomes for people with a disability than the U.S. as a whole. The difference is that Minnesota has a higher share of older Minnesotans with disabilities than nationwide and older people in general are much less likely to be employed.
Unemployment rates are more than twice as high for workers with a disability compared to those with no disability in Minnesota and nationwide and the disparity is even greater for those workers of prime working age than it is for all workers. This is one indicator of how difficult it is for workers with disabilities to successfully engage in the labor market and points to the need for additional employment supports and accommodations as well as more employer acceptance and flexibility.
Workers with a disability have slightly different employment patterns than those with no disability. For example, they are slightly more likely to work for themselves in a non-incorporated business, for a private non-profit organization or unpaid in a family business than workers with no disability in Minnesota. The prevalence of self-employment or family business employment may be another indicator of the difficulty of finding accepting and supportive employers. By occupational grouping, workers with one or more disability are more likely to work in production, transportation and material moving, sales and office, and service occupations than workers with no disabilities.
People of prime working age with a disability are more than three times as likely to live in poverty in Minnesota compared to people with no disability and workers with a disability are more than twice as likely to live in poverty as those without a disability. Moreover, the disparity between people with and without disabilities on the measure of poverty is greater in Minnesota than nationwide. This is a strong indicator of the need to provide more support and accommodations for and acceptance of people with disabilities in the workforce so that we can all share in the opportunities and prosperity of this state and nation.
The Department of Employment and Economic Development's Vocational Rehabilitation Services (VRS) and State Services for the Blind (SSB) are available to assist you if you are a person with a disability who is interested in exploring work opportunities or expanding in your career.
If you are an employer interested in expanding your pool of qualified job candidates, offering paid work experiences for youth, or learning more about supporting persons with disabilities, reach out to our business engagement specialists for more information.
The Minnesota Council on Disability is an employer and employee resource for civil rights technical assistance as it relates to employment (accommodations, interviewing, etc.).