September 2022
Economic disparities between people of color and white people are notable and often significant in America and Minnesota. Black or African Americans in particular face some of the deepest disparities in our country and state, as foundational systemic barriers to prosperity persist. As policymakers, community leaders, businesses, and workforce leaders craft approaches to remove these barriers, one thing we hear consistently is that disaggregated data by race is essential. Understanding the demographic trends and scope of disparities is an important tool for crafting stronger solutions for communities.
This analysis offers an updated look at some of the major demographic, economic, and educational trends, and disparities in the Black community in Minnesota.
Minnesota was home to nearly 400,000 residents who reported Black or African American alone as their race in the 2020 Census, accounting for 7.0% of the state's total population. That number is closer to 450,000 people when a combination of Black with one or more other races is considered. While the state's population grew 7.6% over the past decade, the state's Black or African American alone population increased 45.2%, the equivalent of more than 124,000 new residents, accounting for just over 30% of the state's total population growth. Minnesota's population is rapidly becoming more racially diverse (see Table 1).
| Table 1. Population Change in Minnesota, 2010-2020 | |||||
|---|---|---|---|---|---|
| - | Minnesota | United States | |||
| Race | 2020 Population | 2020 Percent | Change from 2010-2020 | 2020 Percent | |
| Total Population | 5,706,494 | 100.0% | +402,569 | +7.6% | 100.0% |
| White | 4,423,146 | 77.5% | -100,916 | -2.2% | 72.5% |
| Black or African American alone | 398,434 | 7.0% | +124,022 | +45.2% | 12.7% |
| American Indian/Alaska Native | 68,641 | 1.2% | +7,725 | +12.7% | 0.8% |
| Asian & Other Pac. Islander | 302,108 | 5.3% | +85,718 | +39.6% | 5.7% |
| Some Other Race | 168,444 | 3.0% | +65,444 | +63.5% | 4.9% |
| Two or More Races | 345,721 | 6.1% | +220,576 | +176.3% | 3.3% |
| Hispanic or Latino (any race) | 345,640 | 6.1% | +95,382 | +38.1% | 18.7% |
| Source: U.S. Census Bureau | |||||
Among the 50 states, Minnesota has the 22nd largest population overall with 5,706,494 residents, and the 23rd largest Black or African American alone population, with 398,434 people. At 7.0% of the total population, Minnesota had the 28th highest percentage of Black residents; but Minnesota had the 4th largest numeric increase and the 5th fastest increase among all states from 2010 to 2020. In comparison, the Black population increased 5.7% in the U.S. overall since 2010.
Due to a younger age profile and a large number of births over the past two decades, a much higher percentage of Minnesota's Black population is under 35 years of age than the state's white population, which shows a much older age profile. Over 28% of the state's Black population is under 15 years, compared to less than 19% of the total population; while just 6% of Black Minnesotans are 65 years and over, compared to 16.8% of the overall population. In sum, 38.2% of the state's population is in their prime working years, between 25 to 54, compared to 41.6% of Black Minnesotans (see Figure 1).
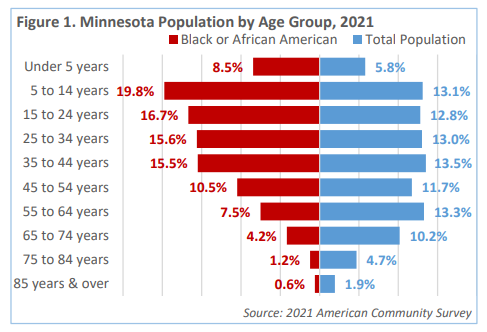
In addition to a natural rate of increase (more births than deaths), Minnesota's Black or African American population has also been growing through rapid international in-migration. Between 2010 and 2021, Minnesota welcomed over 112,000 new foreign-born residents, including more than 63,000 new immigrants from Africa. Africa was the largest and fastest growing continent of origin for immigrants to Minnesota and is now the second largest source of foreign-born residents in the state, after Asia (see Table 2).
With nearly 85,500 residents, the largest number of African immigrants in Minnesota are from Eastern Africa, most notably Somalia and Ethiopia; followed by Western Africa with 32,500 residents, with the largest numbers from Liberia and Nigeria.
| Table 2. Place of Birth for the Foreign Born Population, 2021 | ||||
|---|---|---|---|---|
| - | Minnesota | Change from 2010-2021 | ||
| Number | Percent | Number | Percent | |
| Total, Foreign-born Population | 479,231 | 8.5% | +112,280 | +30.6% |
| Europe | 45,121 | 9.4% | +117 | +0.3% |
| Asia | 177,107 | 37.0% | +41,060 | +30.2% |
| Africa: | 133,255 | 27.8% | +63,053 | +89.8% |
| Africa: - Eastern Africa | 85,446 | 64.1% | +42,160 | +97.4% |
| Africa: - Middle Africa | 4,570 | 3.4% | +3,184 | +229.7% |
| Africa: - Northern Africa | 6,486 | 4.9% | +1,568 | +31.9% |
| Africa: - Southern Africa | 1,536 | 1.2% | +599 | +63.9% |
| Africa: - Western Africa | 32,477 | 24.4% | +15,436 | +90.6% |
| Oceania | 1,885 | 0.4% | +285 | +17.8% |
| Latin America | 110,104 | 90.4% | +8,616 | +8.5% |
| Northern America | 11,759 | 9.6% | -851 | -6.7% |
| Source: 2017-2021 American Community Survey | ||||
Detailed data from the IPUMS USA database1 show that just over 125,000 of Minnesota's Black residents reported Africa as their birthplace. And reflecting the rapid increase in African immigrants over the past two decades, well over one-third of foreign-born residents who entered since 2000 reported Black or African American as their race, which has greatly contributed to the increase in Black residents in the state.
Of current foreign-born Black residents, Minnesota averaged about 400 immigrants per year in the 1980s, then saw a big increase in the early 1990s, averaging about 2,375 new immigrants per year over the decade. That more than doubled to about 5,225 Black immigrants per year in the 2000s, and was trending upward in the 2010s until 2017. From 2010 to 2016, Minnesota was averaging 6,150 Black immigrants per year, then dropped to 2,210 per year from 2017 to 2020, according to IPUMS detailed data.
Comparing the status of Black Minnesotans with Minnesota's white residents reveals many disparities including in educational attainment, industries and occupations of employment, unemployment, and income and poverty levels. Closing these gaps is crucial to keep the state's economy moving forward.
First and foremost, Black Minnesotans exhibited lower educational attainment than their white counterparts, with a much higher share of people with less than a high school diploma and a much lower percentage of people with a bachelor's degree or higher. In sum, 44.2% of Black adults have a high school diploma or less, compared to just 28.3% of white Minnesotans. However, American Indians and people of Some Other Race and Hispanic or Latino origin also had higher shares of adults with lower education in Minnesota.
According to 5-year estimates from the 2021 American Community Survey (ACS), just 22.5% of Black Minnesotans aged 25 years and over had a bachelor's degree or higher, compared to 38.9% of white adults. Black or African Americans, as well as American Indians and people that identified as Two or More Races, had larger shares of people with some college experience or associate's degrees than white Minnesotans (see Figure 2).
Figure 2. Educational Attainment for the population aged 25 years & over by Race or Origin in Minnesota, 2021
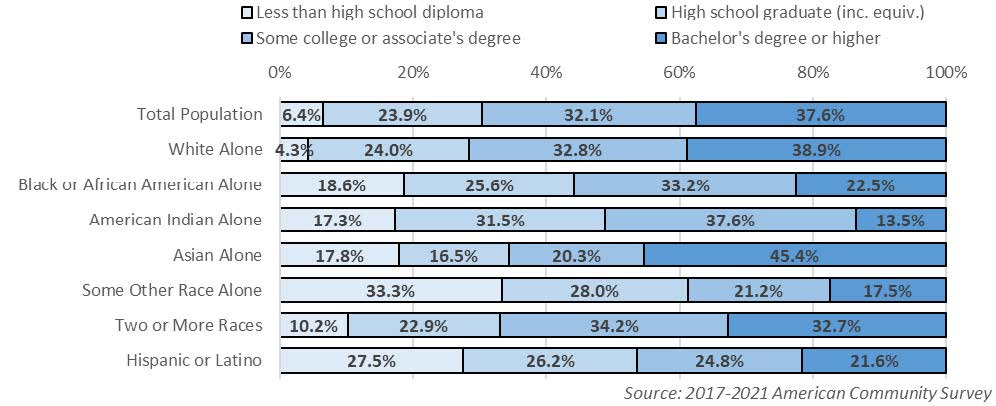
A higher percentage of Minnesota's Black of African American adults aged 25 years and over have less than a high school diploma than the U.S. overall (16.8% vs. 12.0%). The 2021 ACS 1-year estimates show that Minnesota's Black residents have a similar percentage with some college or an associate's degree (31.5% vs. 32.0%) and people with a bachelor's degree or higher (24.3% vs. 24.9%) to the U.S. overall. In sum, about 56% of Minnesota's Black adult population has some college or a degree. In comparison, 73.3% of the state's white population has some college or a degree, compared to 67.3% in the U.S. Only 3.5% of the white adult population does not have a high school diploma.
Minnesota has one of the highest college participation rates, ranking 4th nationally, but racial and ethnic disparities in outcomes are also top-ranked. As Alessia Leibert detailed in her March 2021 article on racial gaps in postsecondary educational attainment, Minnesota's "white and Asian high school students were the most likely (81% and 83% respectively) to enroll in college, while … nearly half (47%) of Black students enrolled but did not complete any credential. Finally, only 18% of Latinx and Black students … completed a bachelor's degree or higher credential versus 32% of white and Asian students."2
Encouragingly, educational attainment has been increasing for Black or African American Minnesotans over the past decade. While the Black population aged 25 years and over increased 50.6% between 2010 and 2021, a gain of about 72,000 people, the number of people with a bachelor's degree or higher expanded by 25,600 people, a 97.0% rise.
According to the 2021 ACS estimates, Minnesota has the 6th highest percentage of Black or African American adults aged 25 years & over with less than a high school diploma, at 16.8%. This partly reflects our larger foreign-born population and the influx over the past decade; whereas the 2010 American Community Survey data showed that Minnesota had the 13th highest percent of Black people aged 25 years and over with less than a high school diploma, at 18.8%. However, the good news is that even with all that in-migration, the percent of Black people in the lowest educational attainment category went down in the state over the decade, from 18.8% in 2010 to 16.8% in 2021.
Minnesota ranks 28th highest for the percent of Black adults who have some college, an associate's degree, bachelor's degree or higher, at 55.8%. South Dakota ranks lowest (44.9%), Wisconsin ranks 5th lowest (48.9%), and Iowa is 8th lowest (51.1%). This is likely a reflection of our higher foreign-born Black population - many new immigrants either have very low educational attainment or very high educational attainment. Minnesota has attracted many well-trained immigrants who are immediately contributing to our economy (see Table 3).
| Table 3. Educational Attainment for Minnesota's Black Adults Aged 25 Years & Over by Birthplace, 2020 | ||||
|---|---|---|---|---|
| Education | Born in America | Born in Africa | ||
| Number | Percent | Number | Percent | |
| High School Diploma or Less | 53,194 | 52.1% | 44,740 | 49.5% |
| 1 year of college | 20,138 | 19.7% | 14,176 | 15.7% |
| 2 years of college | 10,702 | 10.5% | 7,492 | 8.3% |
| Bachelor's Degree or Higher | 18,163 | 17.8% | 23,989 | 26.5% |
| TOTAL POPULATION | 102,197 | 100.0% | 90,397 | 100.0% |
| Source: IPUMS USA, 2016-2020 American Community Survey | ||||
At the more advanced educational attainment levels, Minnesota ranks 28th highest for Black or African American adults aged 25 years & over with some college or an associate's degree (31.5%), just behind the U.S. average (32.0%). North Dakota was 22nd highest (32.6%) and Wisconsin (25th ; 32.3%) were just ahead of us, while Iowa (42nd ; 29.1%) and South Dakota (46th ; 26.0%) were well behind us. Minnesota is 25th highest for Black people aged 25 years and over with bachelor's degree or higher (24.3%), just behind the U.S. average (24.9%). Wisconsin was the 3rd lowest at 16.6%, South Dakota was 6th lowest (18.9%), Iowa was 15th lowest (22.0%), and North Dakota was 21st lowest (23.3%).
In sum, 55.8% of Black adults have some college or an associate's or bachelor's degree or higher in 2021, ranking 29th overall. Ten years ago, we ranked 21st overall for Black people with some college or an associate's or bachelor's degree or higher, at 53.6%. That means we moved down eight spots in the rankings, despite seeing a numeric and percentage increase.
Increasing educational attainment typically leads to better labor force participation and employment outcomes. At 68.4% in 2021, Minnesota's labor force participation rate was much higher than the country (63.0%). At 70.5%, Minnesota's Black or African American labor force participation rate was 3rd highest in the U.S., and was higher than the state's white rate (67.2%). Workers of Hispanic or Latino origin had the highest labor force participation rate in the state at 77.5%. Workers of Two or More Races, Some Other Race, and Asian or Pacific Islanders also had higher rates than the state's white rate; while only American Indians had a lower labor force participation rate than white Minnesotans (see Table 4).
| Table 4. Employment Characteristics by Race & Hispanic Origin, 2021 | |||||
|---|---|---|---|---|---|
| - | Minnesota | United States | |||
| Race | In Labor Force | Labor Force Participation Rate | Unemployment Rate | Labor Force Participation Rate | Unemployment Rate |
| Total Labor Force | 3,115,022 | 68.4% | 4.9% | 63.0% | 6.3% |
| White alone | 2,462,965 | 67.2% | 4.2% | 61.7% | 5.1% |
| Black or African American | 191,755 | 70.5% | 11.0% | 62.3% | 10.6% |
| American Indian & Alaska Native | 22,392 | 60.3% | 10.5% | 61.8% | 9.1% |
| Asian | 167,787 | 75.3% | 4.2% | 65.9% | 5.8% |
| Some Other Race | 84,746 | 77.3% | 6.3% | 67.9% | 7.7% |
| Two or More Races | 182,381 | 74.2% | 7.2% | 66.6% | 7.5% |
| Hispanic or Latino | 175,003 | 77.5% | 7.7% | 67.5% | 7.5% |
| Source: 2021 American Community Survey, 1-Year Estimates | |||||
Black or African Americans accounted for nearly 192,000 workers in Minnesota, which was 6.2% of the total labor force in 2021. That was up from 126,000 workers in 2010, or 4.2% of the state's total labor force a decade ago. The increase of 70,000 Black workers in the state accounted for over one-third of the state's total gain of 160,500 workers from 2010 to 2021. The number of Black or African American workers in the state has been rising rapidly in recent years.
The Black labor force participation rate in Minnesota ticked up 2.5 percentage points in Minnesota from 2010 to 2020, which was the 11th highest increase in the U.S., where rates for Black people essentially held steady over the past decade. As the state's white population ages, the white rate has declined over the past decade. The labor force participation rate for native-born Black people in Minnesota was 66.1%, compared to 77.6% for Black people living in Minnesota who were born in Africa.
While these rates are higher, since the pandemic, the Black labor force participation rate suffered a much larger swing than any other race group in Minnesota. While the white rate declined slowly and steadily from 70.0% to 68.5% and the Hispanic rate actually increased from 76.2% to as high as 80.4%; the Black rate fell from 71.2% to a low of 64.3% in February 2021, but since then began climbing and reached 70.7% in April 2022 before moderating at 69.1% in October (see Figure 3).
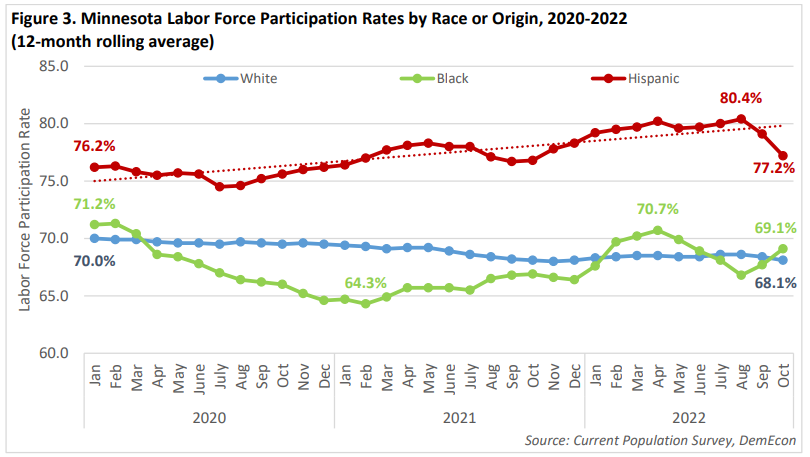
The data clearly show that Black or African Americans were more immediately impacted by the recession, not just in falling labor force participation rates, but also in rising unemployment. Over time, Minnesota has had a significant gap between its white and Black unemployment rate, with the Black rate typically being at least twice as high as the white rate. Going back to 2010, in the depths of the Great Recession, the Black unemployment rate was 16.7% in Minnesota, which was essentially triple the white rate of 5.6%.
At that same time nationally, the Black unemployment rate was 14.0% and the white rate was 6.8% in 2010, showing Minnesota had a higher rate and a bigger gap for Black or African American workers. Among the 50 states and DC, Minnesota had the 5th highest rate for Black people in 2010, and the 5th largest gap between the white and Black rate.
But over the course of the decade, employment prospects for Black or African Americans improved in Minnesota. At 8.7% in 2020, Minnesota had the 26th lowest unemployment rate for Black people in the U.S., though the rate was still 2.7 times higher than the white rate at 3.2%. Minnesota still had a large disparity between the two, but it was now down to the 11th largest gap in the U.S., showing improvement over the decade.
As Minnesota's economy continued to grow and the labor market grew tighter in 2019 and 2020, the gap was closing even more, up until the pandemic. Based on 12-month rolling averages, the Black unemployment rate in Minnesota had dropped as low as 4.5% in February and March of 2020, just 1.5% above the white rate of 3.0% in both of those months.
However, following the outset of the pandemic in April of 2020, Black or African American workers suffered worse outcomes and unemployment rates more than doubled over the course of the next year, hovering between 9.0% and 10.0% until April of 2021. Then as the labor force participation rate declines for Black Minnesotans started to factor in as described above in Figure 3, unemployment rates appeared to drop significantly, even falling below the white rate for four months in the summer of 2021, before starting to ramp back up as Black workers returned to the labor force. In the summer of 2022, the Black rate had climbed back above 7.0% for a couple months, while the white rate dropped to historic lows. Moving into the fall, rates dropped rapidly for Black people, down to 5.0% in October of 2022, compared to 2.1% for white Minnesotans (see Figure 4).
Figure 4. Minnesota Unemployment Rates by Race or Origin, 2020-2022, 12-month Moving Averages
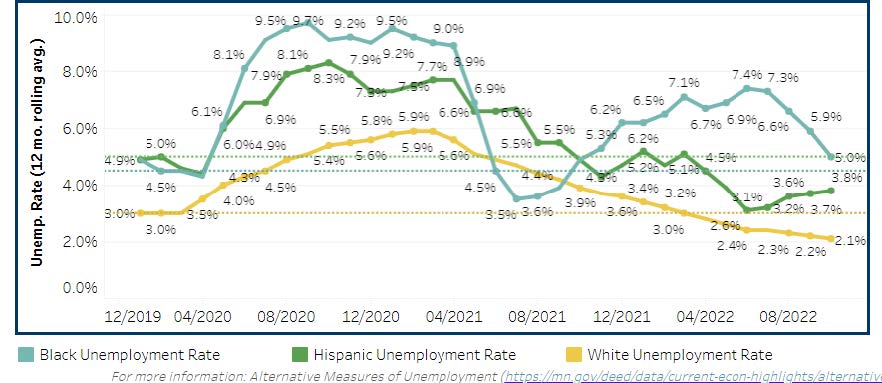
The fluctuations are significant and create a constantly changing picture of struggle and success. For example, according to 2021 average annual data from the Bureau of Labor Statistics, at 6.2%, Minnesota actually had the 5th lowest Black unemployment rate in the U.S. (though it's important to note that only 35 states had data available). And the 2.6% gap between our white and Black rate was the 9th smallest in 2021. While the gap remains, the data show we're doing better than surrounding states including Wisconsin, both in rate (10.7%) and overall gap (7.6%).
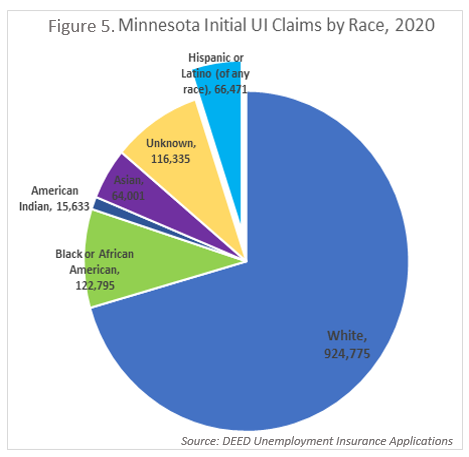 Looking at unemployment activity, in 2020 there were nearly 1,250,000 initial claims for Unemployment Insurance (UI) benefits filed by workers in Minnesota, nearly triple the number filed in 2009 during the Great Recession, which was the previous high. Of the initial claims in 2020, about 74% were filed by white Minnesotans, compared to 9.9% of claims filed by Black or African Americans (see Figure 5).
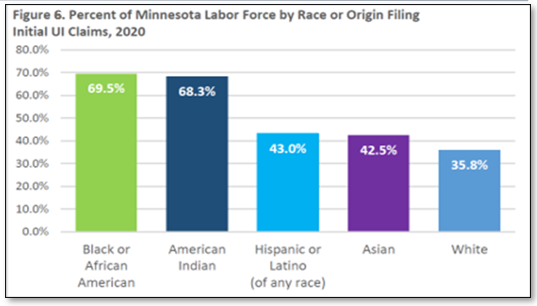
Comparing the number of initial claims filed to the number of workers in the labor force by race in 2020 shows a clear picture of the different impact that the pandemic recession had on workers of different races. More than two-thirds of Black or African American workers in Minnesota filed an initial claim in 2020, compared to about one-third of white workers (see Figure 6).
A big reason is that a high share of Black or African Americans in Minnesota work in the Health Care industry and other customer-facing industries like Leisure & Hospitality, Retail Trade and Other Services, which were all severely impacted by pandemic containment measures.
The number of UI continued claims for Black workers saw a much faster increase from April 2019 to April 2020 than for white Minnesotans (+1,392.7% v. +904.2%) and also a slower decrease from April 2020 to April 2021 (-46.6% v. -75.7%). And while the number of continued claims filed by white Minnesotans was lower in April 2022 than April 2019, the number of continued claims for Black people was still elevated by just over 60% in April 2022 compared to 2019, showing their return to work has not been as smooth or successful.
Along with the declining labor force participation described above, UI data also shows that the average duration of unemployment was longer for Black Minnesotans than for white Minnesotans. The average number of UI weeks climbed to 27.4 weeks for Black Minnesotans from March of 2020 to March of 2021, compared to just 18.4 weeks for white Minnesotans. In addition, Black Minnesotans were also much more likely to still be filing continued claims for unemployment insurance benefits after March 5, 2021, at 45.0%, compared to just 22.0% for white Minnesotans (see Table 5).
Table 5. Profile of Risk for Prolonged Unemployment, Minnesota, 2020-2021

While the majority of Minnesota's total jobs are held by workers reporting as white, recent and historical trends show the state's workforce is becoming increasingly racially diverse with each year. Workers reporting as Black or African American, for example, held 3.6% of the state's total jobs in 2000, which increased to 4.5% in 2010, and to 6.6% in 2020 (see Figure 7).
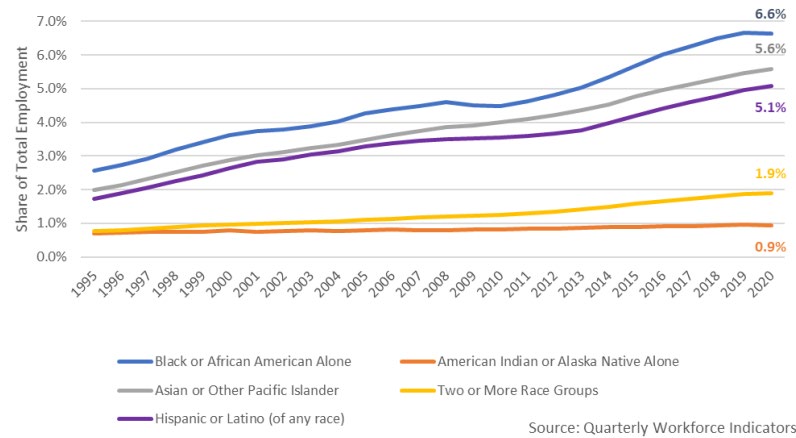
After the severe job loss due to the pandemic recession in early 2020, Minnesota's economy began adding jobs again in 2021. According to Quarterly Workforce Indicators data from the U.S. Census Bureau, Minnesota had an average of 2,723,809 jobs across the first three quarters of 2021. Broken down by race, nearly six-in- seven jobs (84.8%) were held by persons reporting as white. As shown in Figure 7, Black or African Americans accounted for 6.6% of the state's jobs, which was the largest of any race other than white.
Despite the pandemic recession, Minnesota's total employment still increased 7.7% from 2010 to 2021. This was equivalent to about 194,000 additional jobs. At a more detailed level, the number of jobs held by those reporting as white increased by 2.1% during this time (about 47,000 jobs), while jobs held by those reporting as a race other than white increased by 55% (about 147,000 jobs). Black or African American workers witnessed the largest numeric increase in jobs held between 2010 and 2021, adding approximately 66,205 jobs. Data clearly show that Minnesota's economy would not have been able to expand without our growing, diverse labor force (see Table 6).
| Table 6. Minnesota Employment by Race and Ethnicity, 2010-2021 | ||||||
|---|---|---|---|---|---|---|
| - | 2010 Jobs | 2021 Jobs* | 2010-2021 Change | |||
| Number | Share | Number | Share | Numeric | Percent | |
| Total, All Jobs | 2,619,788 | 100.0% | 2,723,809 | 100.0% | +193,849 | +7.7% |
| White | 2,263,150 | 86.4% | 2,310,120 | 84.8% | +46,970 | +2.1% |
| Black or African American | 113,594 | 4.3% | 179,799 | 6.6% | +66,205 | +58.3% |
| American Indian or Alaska Native | 20,630 | 0.8% | 25,221 | 0.9% | +4,591 | +22.3% |
| Asian | 100,965 | 3.9% | 155,454 | 5.7% | +54,489 | +54.0% |
| Two or More Race Groups | 31,621 | 1.2% | 53,215 | 2.0% | +21,594 | +68.3% |
| Hispanic or Latino (of any race) | 89,828 | 3.4% | 142,461 | 5.2% | +52,633 | +58.6% |
| Source: Quarterly Workforce Indicators, * = Avg. of Qtr.1 – Qtr. 3 2021 | ||||||
At 15.0%, Minnesota's share of jobs held by non-white workers placed it 30th in the nation.3 While Minnesota does not place near the top of the nation's states with the most diverse workforces, its large numeric and rapid percentage growth of racially and ethnically diverse workers ranks much more highly. In fact, the 53.5% increase in jobs held by non-white workers between 2010 and 2020 placed it 7th in the nation. Only Illinois, North Dakota, Utah, Iowa, Idaho, and Maine had faster growth rates in this regard.
Looking back further and more specifically by race, the number of jobs held by Black or African American workers in Minnesota nearly doubled between 2000 and 2021 – from 92,344 jobs to 179,799 jobs in 2021, a 94.7% increase. However, this varied greatly by industry. Of the 20 main industries, 17 added Black workers over the past 2 decades in Minnesota. Health Care & Social Assistance saw the biggest increase and no other industry is even close – it accounted for 78% of the jobs added since 2000.
The fastest rise in jobs held by Black workers occurred in Agriculture, which added about 600 jobs for a 424% increase, but still had less than 750 total jobs held by Black workers in the state. Ten industries saw more than a 50% increase in Black workers, with the largest gains seen in Retail Trade, Manufacturing, Educational Services, and Transportation & Warehousing.
With more than 67,000 jobs, about 13.3% of the state's Health Care & Social Assistance workforce is Black or African American, which is the highest concentration of any industry. In 2021, well over one-third (37.4%) of Black or African American Minnesotans held jobs in the Health Care & Social Assistance industry, after increasing more than 330% from 2000 to 2021. That was more than four times as many who worked in the next most popular industries: Manufacturing (9.1%), Retail Trade (8.9%), and Administrative Support & Waste Management Services (8.3%), which includes temp help and staffing agencies (see Figure 8).
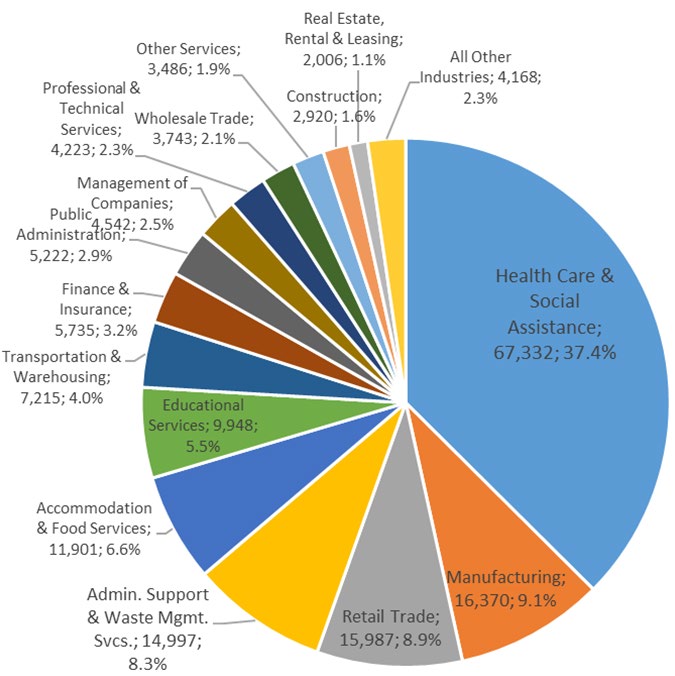
While 37.4% of Black Minnesotans held jobs in Health Care & Social Assistance, in comparison just 17.0% of white Minnesotans held jobs in Health Care & Social Assistance, and only 4.1% worked in Admin. Support & Waste Management Services. Black Minnesotans are also more likely to be working in Transportation & Warehousing, but much less likely than white Minnesotans to be working in industries like Construction, Educational Services, Wholesale Trade, Finance & Insurance, and Public Administration.
As noted above, Black people held about 6.6% of total jobs in the state, and other than Health Care, the other industries that had above average concentrations include Administrative Support & Waste Management Services (12.3% of total jobs), Transportation & Warehousing (9.5%), and Accommodation & Food Services (6.7%). Black or African American workers accounted for between 4% and 6% of total employment in several other industries including Real Estate, Rental & Leasing (6.1%), Retail Trade (5.8%), Manufacturing (5.3%), Management of Companies (4.9%). In contrast, Black Minnesotans held less than 1.0% of total jobs in Mining (0.4%).
Just like Black or African American workers are more likely to be employed in certain industries, there are also differences in the occupations that are held by Black people. Again, detailed data from the IPUMS USA database4 show that the most common occupations for Black or African American Minnesotans are Personal Care Aides and Nursing & Home Health Aides, which combined represent almost 11% of total Black employment. In comparison, just 2.2% of white workers were employed in these occupations. Of the nearly 100,000 people employed in these occupations in the state, about 21,500 of them are Black or African American.
As shown in Table 6, Black or African American workers account for just over 20% of the Personal Care Aides and Nursing & Home Health Aides in the state, and over 14% of the state's Assemblers & Fabricators and Maids & Housekeeping Cleaners. In addition, Black Minnesotans account for over 40% of the state's Telephone Operators and Taxi Drivers & Chauffeurs, over 30% of the state's Postal Service Mail Sorters & Processors, Budget Analysts, and Parking Lot Attendants, and more than 20% of the Barbers, Transportation Workers, Baggage Porters & Bellhops, and Media & Communication Workers in Minnesota. In contrast, there are over 100 occupations that did not show any Black workers in Minnesota.
Cashiers are the 3rd most common occupation for Black workers in Minnesota, with the top 10 rounded out by Customer Service Representatives, Janitors & Building Cleaners, Assemblers & Fabricators, Laborers & Freight Movers, Chefs & Cooks, Registered Nurses, and Route Sales Drivers and Truck Drivers (see Table 7).
| Table 7. Top 15 Occupations held by Black or African American Workers in Minnesota, 2020 | Black or African American Alone Workers | Percent of Total Black Workers | White Alone Workers | Percent of Total White Workers | Total Workers, All Races | Black Percent of Total Workers |
|---|---|---|---|---|---|---|
| Personal Care Aides | 11,127 | 5.6% | 30,833 | 1.0% | 49,020 | 22.7% |
| Nursing, Psychiatric, & Home Health Aides | 10,454 | 5.2% | 34,939 | 1.2% | 50,974 | 20.5% |
| Cashiers | 8,232 | 4.1% | 55,840 | 1.9% | 76,181 | 10.8% |
| Customer Service Representatives | 6,211 | 3.1% | 54,751 | 1.8% | 68,318 | 9.1% |
| Janitors & Building Cleaners | 5,473 | 2.7% | 46,684 | 1.6% | 61,005 | 9.0% |
| Assemblers & Fabricators | 5,096 | 2.6% | 21,792 | 0.7% | 35,911 | 14.2% |
| Laborers & Freight & Stock Movers, Hand | 5,041 | 2.5% | 42,184 | 1.4% | 54,643 | 9.2% |
| Chefs & Cooks | 4,555 | 2.3% | 41,881 | 1.4% | 59,990 | 7.6% |
| Registered Nurses | 4,339 | 2.2% | 74,989 | 2.5% | 85,027 | 5.1% |
| Driver/Sales Workers & Truck Drivers | 4,137 | 2.1% | 70,804 | 2.4% | 78,303 | 5.3% |
| First-Line Supervisors of Sales Workers | 3,917 | 2.0% | 80,325 | 2.7% | 91,461 | 4.3% |
| Maids & Housekeeping Cleaners | 3,887 | 2.0% | 17,123 | 0.6% | 27,186 | 14.3% |
| Childcare Workers | 3,545 | 1.8% | 34,949 | 1.2% | 41,446 | 8.6% |
| Stock Clerks & Order Fillers | 3,363 | 1.7% | 31,240 | 1.0% | 38,718 | 8.7% |
| Retail Salespersons | 3,307 | 1.7% | 63,566 | 2.1% | 74,601 | 4.4% |
| Source: U.S. Census Bureau, IPUMS USA, University of Minnesota, IPUMS Center for Data Integration | ||||||
Notably, with the exception of Registered Nurses (RNs), the other 14 occupations that Black or African American workers are most likely to have do not require postsecondary education. Expanded to the top 30 most common occupations, only 7 require postsecondary education, including RNs, Licensed Practical Nurses (LPNs), Elementary & Middle School Teachers, Social Workers, Computer Scientists & Systems Analysts, Accountants & Auditors, and Medical Assistants.
The Census Bureau's Annual Business Survey5 shows that with 1,536 firms, Black or African Americans account for about 1.4% of business ownership among classifiable employer firms in Minnesota in 2019. White people account for nearly 88.5%, 3.4% are owned by Asian residents, about 1.6% have Hispanic or Latino ownership, and less than a half percent of firms are owned by American Indians. In each case other than white, the percent of business ownership is lower than each race group's share of the total labor force, with the biggest gap shown for Black people (see Figure 9).
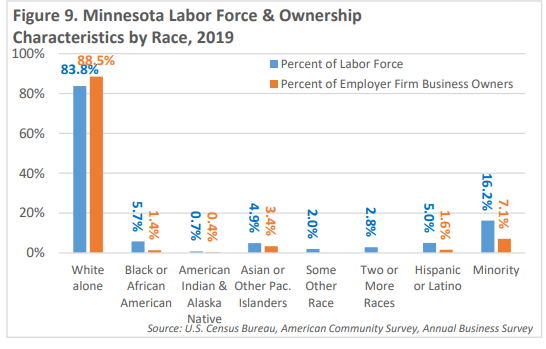
At 1.4%, Minnesota had the 27th highest percent of Black business ownership in the U.S., well ahead of Wisconsin (0.7%), Iowa(0.3%), and South Dakota (0.2%). But similar to our overall population, Minnesota’s business ownership of firms that employ others is less racially diverse than the U.S. For comparison, about 2.3% of all classifiable firms in the U.S. were Black owned in 2019. While our Black ownership is relatively low, Minnesota had the 22nd smallest gap between our percent of Black business owners and percent of the population that is Black.
Even more encouragingly, Minnesota saw a 36.9% increase in the number of Black- owned employer firms from 2012 to 2019, compared to a 23.3% increase across the U.S. That is even more impressive when seeing that Minnesota's total employer firm growth rate was about half as fast as the U.S. growth rate of 6.4% from 2012 to 2019. In other words, Minnesota still has a smaller percentage of Black-owned firms but was seeing much faster growth in Black ownership than the U.S. over the past decade.
Minnesota's 1,536 businesses employed about 27,700 paid employees in 2019. With 826 businesses, more than half (53.8%) of the Black-owned employer firms in Minnesota are in the Health Care & Social Assistance industry, and with 22,264 jobs, they also account for just over 80% of paid employment at Black-owned firms. Though the actual number of firms wasn't disclosed in the 2019 data, Retail Trade had the second largest amount of employment with between 1,000-2,499 employees.
The next largest concentrations were in Professional & Technical Services, Transportation & Warehousing, and Accommodation & Food Services. Interestingly, the average number of employees per firm was larger for Black-owned businesses in Health Care & Social Assistance and Transportation & Warehousing, but much smaller in Professional & Technical Services, Accommodation & Food Services, and Administrative Support & Waste Management Services (see Table 8).
| Table 8. Minnesota Annual Business Survey Statistics, 2019 | ||||
|---|---|---|---|---|
| - | Number of Firms | Percent Black | ||
| Black | White | Total | ||
| Total, All Industries | 1,536 | 99,602 | 112,555 | 1.4% |
| Health Care & Social Assistance | 826 | 6,890 | 10,028 | 8.2% |
| Retail Trade | D | 10,377 | 11,643 | ~0.9% |
| Professional & Technical Services | 119 | 14,048 | 15,448 | 0.8% |
| Transportation & Warehousing | 81 | 4,065 | 4,394 | 1.8% |
| Accommodation & Food Services | 69 | 7,257 | 8,736 | 0.8% |
| Admin. Support & Waste Mgmt. Svcs. | 51 | 5,662 | 6,144 | 0.8% |
| Manufacturing | 13 | 5,840 | 6,464 | 0.2% |
| Finance & Insurance | D | D | 6,304 | ~0.3% |
| Wholesale Trade | D | 5,238 | 6,189 | ~0.2% |
| Construction | D | 16,408 | 16,716 | ~0.1% |
| Information | D | 1,225 | 1,556 | 3.2% |
| Real Estate, Rental & Leasing | D | 5,814 | 6,148 | ~0.2% |
| Management of Companies | D | D | D | ~0.0% |
| Educational Services | D | 1,057 | 1,780 | ~0.1% |
| Arts, Entertainment & Recreation | D | 1,468 | 2,350 | ~0.0% |
| Other Services | D | 7,190 | 7,752 | ~0.0% |
| Agriculture, Forestry, Fish & Hunting | 0 | D | D | 0.0% |
| Mining, Quarrying & Oil & Gas | 0 | 98 | 109 | 0.0% |
| Utilities | 0 | D | 106 | 0.0% |
| Source: U.S. Census Bureau, Annual Business Survey
(D=data not disclosable) |
||||
Racial disparities exist in employment characteristics and are also found in economic outcomes as measured by household income and poverty levels. The U.S. median household income climbed to $69,717 in 2021, which was about $8,000 lower than Minnesota's median household income of $77,720. At that level, Minnesota's median household income was the 14th highest in the United States, well ahead of all surrounding states including Wisconsin ($67,125; 23rd), North Dakota ($66,519; 27th), South Dakota ($66,143; 30th), and Iowa ($65,600; 31st). Minnesota has had above average incomes for several decades and is well known and established as a high-income state.
However, median household incomes varied widely by racial groups in the state. At $47,739, the median income for Black or African American households in Minnesota was significantly lower – about $33,000 lower – than those of white Minnesotans. Except for Asians, all other households of color in the state also had substantially lower household incomes than white Minnesotans (see Figure 10). Slightly below the U.S. median of $46,774 for Black or African American households, Minnesota had the 22nd highest level, just ahead of surrounding states other than North Dakota ($45,023; 26th), Iowa ($41,436; 36th), South Dakota ($39,986; 40th), and Wisconsin ($36,379; 45th).
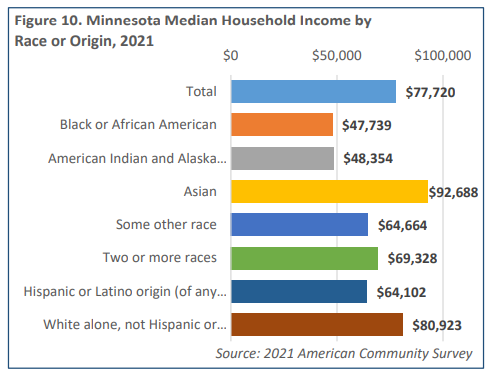
Like job prospects, median incomes have been rising rapidly for Black or African American households in Minnesota over the past decade, jumping 63.1% from 2011 to 2021. That was the 7th fastest growth rate in the U.S., where the median Black or African American household income increased 40.8%. Minnesota climbed from the 33rd highest income level for Black people in 2011 to 22nd highest in 2021.
Still, Minnesota's Black households had lower incomes than Black households in the U.S. overall. In 2020, Minnesota had a higher percentage of Black households earning less than $50,000 at 58.9% compared to 55.3%, and a lower percentage of Black households earning more than $100,000 than the U.S., at 5.1%, compared to 7.0% (see Figure 11).
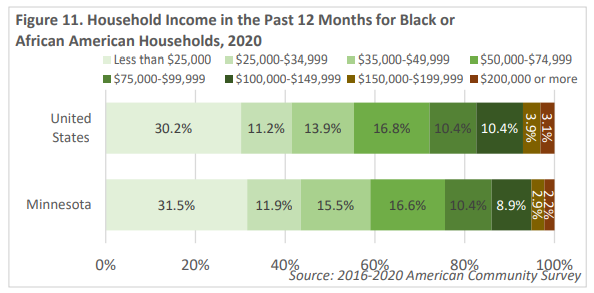
Almost one-third of Black or African American households in Minnesota had income below $25,000 in 2020. In comparison, only 13.3% of white households in Minnesota had incomes below $25,000. About 14% of Black households in Minnesota had incomes above $100,000; compared to 36.5% of white households.
Perhaps surprisingly, according to IPUMS data from 2020, there were only slight differences in the percentage of Black Minnesotans with various household income levels depending on their birthplace. Whether native born or African born, nearly 50% of Black residents were living in households with income below $50,000 in 2020. In contrast, less than 20% of Black Minnesotans were living in households with incomes above $100,000 (see Table 9).
| Table 9. Total Persons by Household Income for Black Minnesotans, 2020 | ||||
|---|---|---|---|---|
| - | Born in America | Born in Africa | ||
| Number | Percent | Number | Percent | |
| $0-$24,999 | 52,688 | 22.9% | 25,201 | 20.5% |
| $25,000-$49,999 | 58,739 | 25.5% | 35,224 | 28.6% |
| $50,000-$74,999 | 36,490 | 15.9% | 21,187 | 17.2% |
| $75,000-$99,999 | 26,724 | 11.6% | 16,601 | 13.5% |
| $100,000-$249,999 | 38,321 | 16.7% | 20,876 | 16.9% |
| $250,000 or more | 3,775 | 1.6% | 2,188 | 1.8% |
| Unknown | 13,384 | 5.8% | 1,914 | 1.6% |
| TOTAL | 230,121 | 100.0% | 123,191 | 100.0% |
| Source: U.S. Census Bureau, IPUMS USA, University of Minnesota, | ||||
A final measure of economic outcome is the percent of the population below the poverty level, and again there exists disparities between white Minnesotans and Black or African Americans in Minnesota. Overall, the state poverty rate was 9.3%, which is 3.5% below the national rate. However, in 2021 it was estimated that more than 20% of the state's Black or African Americans reported incomes below the poverty level, compared to just 7.5% of the white population. Minnesota's poverty rate was much lower than the nation's rate overall; but for Black or African Americans, Minnesota's poverty rates were nearly identical (see Table 10).
| Table 10. Poverty Status in the past 12 months by Race or Origin in Minnesota, 2021 (total population for whom poverty status is determined) | ||||
|---|---|---|---|---|
| - | Total Population | Income below the poverty level | Poverty Rate (% below poverty level) | U.S. Poverty Rate |
| Total Population | 5,587,189 | 519,731 | 9.3% | 12.8% |
| White Alone | 4,350,858 | 326,270 | 7.5% | 9.8% |
| Black or African American Alone | 373,562 | 78,080 | 20.9% | 21.8% |
| American Indian Alone | 44,271 | 10,809 | 24.4% | 21.4% |
| Asian Alone | 283,994 | 32,970 | 11.6% | 10.2% |
| Some Other Race Alone | 148,869 | 19,007 | 12.8% | 19.0% |
| Two or More Races | 383,809 | 52,381 | 13.6% | 15.4% |
| Hispanic or Latino | 325,017 | 46,981 | 14.5% | 17.5% |
| Source: 2021 American Community Survey, 1-Year Estimates | ||||
At 9.3%, Minnesota has the 3rd lowest poverty rate in the U.S., and was lower than all our neighboring states – Wisconsin (10.8% ; 14th lowest), Iowa (11.1% ; 16th), North Dakota (11.1% ; 16th), and South Dakota (12.3% ; 30th). For Black people, Minnesota had the 24th lowest poverty rate at 20.9%, which was behind South Dakota (19.0% ; 12th) and just ahead of North Dakota (21.3% ; 25th lowest), but way ahead of Iowa (28.3% ; 44th) and Wisconsin (29.5% ; 47th). However, this is a great improvement compared to 2011, when the Black poverty rate in Minnesota was 37.1%.
These racial disparities exist and persist for a wide variety of reasons, but the economic challenges and opportunities Minnesota will face in the future are great will need to be tackled with an equitable and multi- pronged approach to attracting, retaining, and training workers of all demographic characteristics. Working on solutions to address these disparities between the white population and populations of color is not only the right thing to do, it's the necessary thing to do if Minnesota is going to provide employers with the workforce needed for success.
1Steven Ruggles, Sarah Flood, Ronald Goeken, Megan Schouweiler and Matthew Sobek. IPUMS USA: Version 12.0 [dataset]. Minneapolis, MN: IPUMS, 2022.
2Leibert, Alessia. "How The Deck is Stacked." March 2021 Minnesota Economic Trends.
33 O'Neill, Timothy. "Minnesota's Diversifying Workforce." March 2022 Economic Trends.
4Steven Ruggles, Sarah Flood, Ronald Goeken, Megan Schouweiler and Matthew Sobek. IPUMS USA: Version 12.0 [dataset]. Minneapolis, MN: IPUMS, 2022
55 The U.S. Census Bureau released new estimates on the characteristics of employer businesses in late 2021. According to the 2020 Annual Business Survey (ABS), which covers reference year 2019, approximately 18.7% (1.1 million) of U.S. employer businesses were minority-owned.