by Dave Senf
September 2018
Note: All data except for Minnesota’s PMI have been seasonally adjusted. See the feature article in the Minnesota Employment Review, May 2010, for more information on the Minnesota Index.
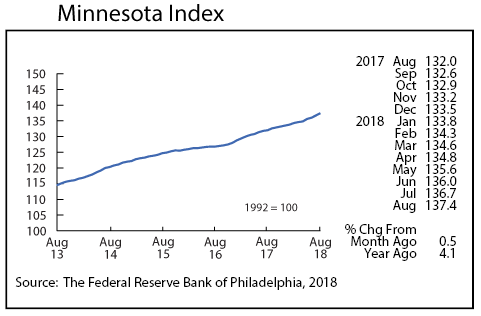
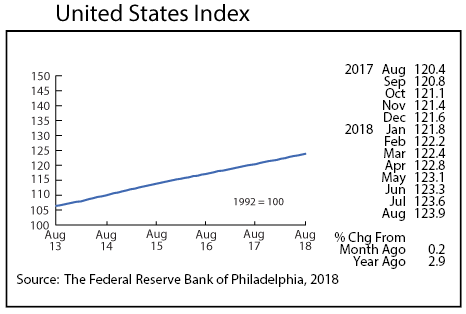
The Minnesota Index continued its hot pace in August, racing to a 0.5 percent increase. The index was up despite no change in wage and salary employment in August. Another small drop in the unemployment rate and a robust jump in average weekly manufacturing hours kept the index humming along.
The average monthly gain over the last 39 years is 0.2 percent. The 0.5 percent average monthly increase since May indicates that Minnesota’s economy expanded at over twice the normal rate during the summer. Minnesota’s index is up 1.9 percent since April while the U.S. index, which advanced 0.2 percent in August, is up only 0.9 percent over the same four month period. Minnesota’s index has increased 4.1 percent since last August while the U.S. index has lagged behind, advancing by 2.9 percent over the last 12 months.
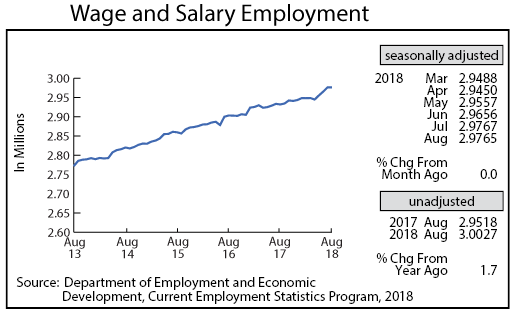
Minnesota’s adjusted Wage and Salary Employment took a breather in August, remaining essentially unchanged. Private employers cut 1,200 jobs in August while public sector payroll increased 1,000 jobs for a net loss of 200 jobs. Job cutbacks in the private sector were in Service-Providing industries as Goods-Producing industries added jobs for the fifth month in a row. Construction employment was up for the fifth straight month but Manufacturing payrolls decreased for the first time in eight months. Job cutbacks were heaviest in Educational and Health Services, Manufacturing, and Trade, Transportation, and Utilities.
Minnesota’s unadjusted over-the-year job growth retreated in August to 1.5 percent compared to 1.8 percent nationwide. Through the first eight months of the year Minnesota has averaged 1.1 percent over-the-year growth. Over-the-year job growth nationally has average 1.7 percent through August.
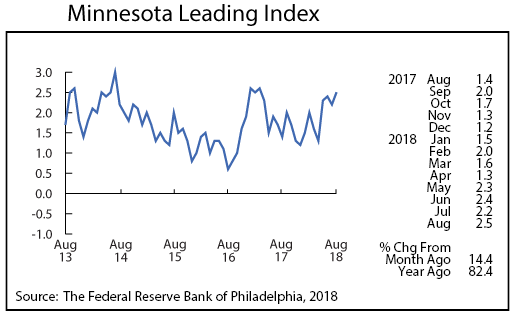
The Minnesota Leading Index remained at an elevated level, climbing to 2.5 in August, its highest reading since April 2017. Minnesota’s leading index was higher than the national leading index for the fourth straight month, suggesting that the state’s economy will likely expand faster than the U.S. economy through the last four months of the year.
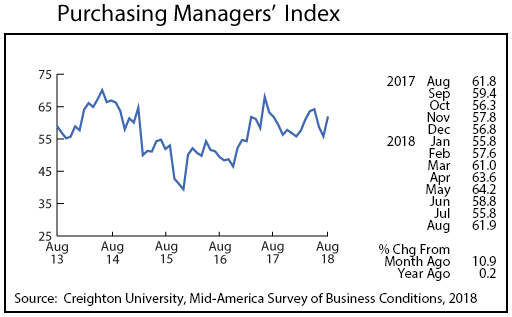
Minnesota’s Purchasing Managers’ Index (PMI) which reports the results of a survey of purchasing managers in Minnesota by researchers at Creighton University in Omaha rose to 61.9 in August after having declined the previous two months. The index provides an early indicator of where Minnesota’s economy is headed over the next three to six months. August’s solid 61.9 reading suggest that the state’s economy will continue to expand at a faster-than-normal clip for the rest of 2018.
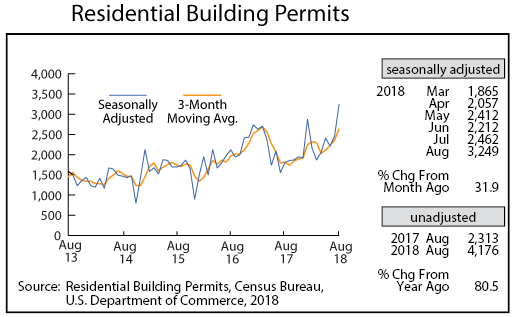
Adjusted Residential Building Permits skyrocketed to 4,176 in August, the 13th highest monthly total recorded since 1970. The jump was fueled mainly by a large increase in apartment permits. Minnesota accounted for 7 percent of all apartment building permits issued in the U.S. in August. Minnesota home builders have taken out 2.1 percent of all U.S. home-building permits through the first eight months of the year. That is slightly higher than the state’s 1.9 percent share of U.S. population.
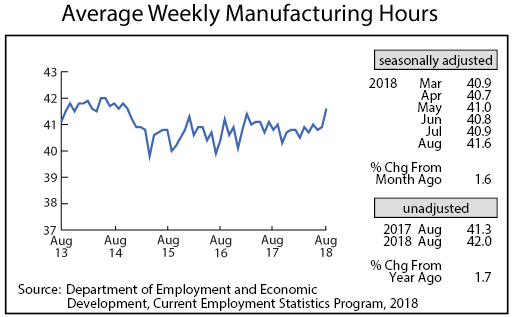
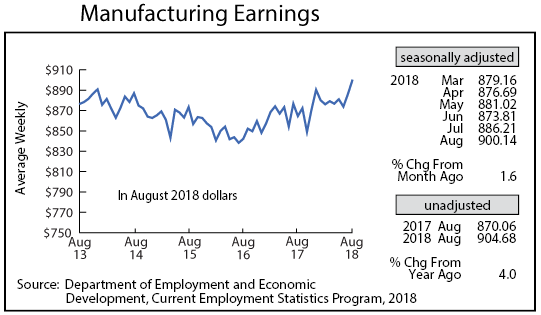
Adjusted average weekly Manufacturing Hours spiked up to 41.6 hours. This was the highest factory workweek since February 2014. Higher manufacturing hours were expected given the uptick in manufacturing hiring during the last 12 months. Average weekly Manufacturing Earnings adjusted for inflation and seasonality also jumped sharply reaching an all-time high of $900.14. Real factory earnings were up 4.1 percent compared to a year ago suggesting that manufacturers are raising wages to attract workers in addition to adding overtime work.
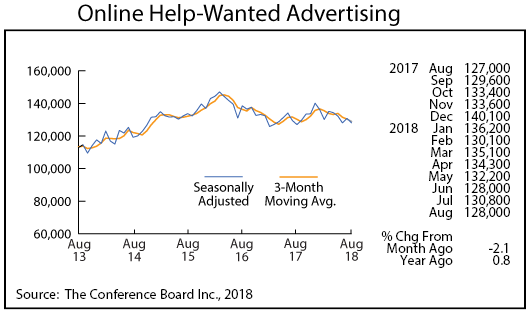
Online Help-Wanted Ads inched down in August to 128,000, decreasing by 2.1 percent. U.S. job postings also slipped, falling 1.0 percent. Job postings online as compiled by the Conference Board are down slightly this year compared to 2016-2017 levels, but job vacancies measured by Minnesota’s Job Vacancy Survey (JVS) hit an all-time high in the second quarter this year. The recently released JVS data show that there were 142,300 job vacancies which works out to 0.6 unemployed persons for each vacancy. This ratio was down from the 0.9 ratio in 2017 and is another gauge of just how tight the state’s labor market has become.
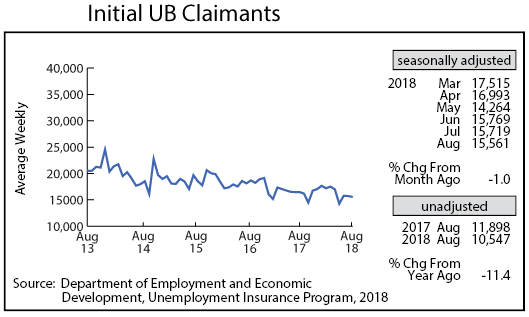
Adjusted Initial Claims for Unemployment Benefits (UB) hardly changed in August for the third consecutive month. Employers are hanging on to their workers as business is good, and finding new workers is a challenge in the tight job market. Total initial claims for the year are running 0.9 percent lower than last year through the first eight months of the year.