by Nick Dobbins
February 2015
Monthly analysis is based on unadjusted employment data.
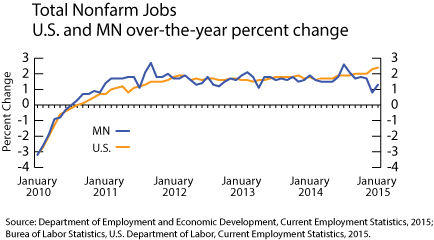
Employment declined significantly in January as the metro lost 39,885 jobs (2.1 percent) on the month. While that number is quite large, employment losses on this scale are actually well within the normal historical pattern for January as employers roll back staffing levels increased for the holiday season. As would be expected, the largest numerical decline came in Trade, Transportation, and Utilities which lost 11,659 jobs (3.3 percent). Most of that loss came from the Retail Trade industry group which shed 8,502 jobs (4.5 percent). Other supersectors with notable job losses included Mining, Logging, and Construction (down 7,063 or 10.4 percent) and Professional and Business Services (down 7,268, 2.4 percent). Every supersector saw some level of employment declines in January. Over the year, however, the employment picture is flipped, with 30,670 jobs (1.7 percent) added since January 2014 and every supersector save two increasing employment. The Information industry lost 297 jobs, and Government employers lost 304. The largest annual increase, both proportionally and numerically, came in the Professional and Business Services supersector, which added 9,509 jobs (3.3 percent). This pattern of monthly losses combined with over-the-year gains was mirrored in every Minnesota MSA.
The MSA lost 3,702 jobs (2.7 percent) in January. The employment drop was spread across the market, as Information (up two jobs or 0.1 percent) was the sole supersector to gain jobs. Some of the more dramatic declines came in Mining, Logging, and Construction (down 694, 7.8 percent), Trade, Transportation, and Utilities (down 766, 2.9 percent), and Government (down 1,526 jobs, 5.6 percent). The lion's share of the losses to Government employment came among State Government agencies, which shed 1,013 jobs (13.1 percent) in January. For the year the Duluth MSA has showed a slight increase in employment, up just 173 jobs (0.1 percent) since January 2014. Strong increases in Trade, Transportation, and Utilities (up 1,085 or 4.4 percent) were offset by losses in Government (down 784, 3 percent) and in Financial Activities (down 375, 6.5 percent) among other gains and losses.
Employment was down 2,037 (1.8 percent) in January as holiday seasonal employment waned. As was the pattern, every published supersector lost jobs except for Information which grew slightly (up 19 jobs, 0.9 percent). Some of the largest declines came in Trade, Transportation, and Utilities (down 518 or 2.9 percent) and Mining, Logging, and Construction (down 356, 9.2 percent). Over the year Rochester added 1,132 jobs (1.0 percent). The only supersectors to lose employment on the year were Manufacturing (down 165, 1.5 percent) and Financial Activities (down 3, 0.1 percent). Contrary to trends in other metros and statewide, the largest employment increase came in Government which added 379 jobs (3.1 percent).
The MSA lost 2,712 jobs (2.5 percent) in January. The only supersector that didn't shed jobs was Educational and Health Services which added 25 (0.1 percent). The largest declines came in the expected industries, with Trade, Transportation, and Utilities dropping 978 jobs (4.4 percent). The biggest proportional drop came in Mining, Logging, and Construction which lost 502 jobs (8.8 percent). Annually the St. Cloud metro added 1,493 jobs (1.4 percent), largely thanks to strong increases in Educational and Health Services (up 1,119 or 5.5 percent) and Mining, Logging, and, Construction (up 568, 12.3 percent). Gains in those and other supersectors overcame losses in Professional and Business Services (down 681, 7.7 percent), Government (down 161, 1.1 percent), and Information (down 98, 5.9 percent).
Employment slid by 1,058 jobs (1.9 percent) in January. All of the losses came from Private employers, as Government employment was up 50 (0.6 percent) for the month. Goods Producers lost 262 jobs (2.6 percent) while Service Providers lost 796 (1.7 percent). For the year the Mankato MSA added 1,134 jobs (2.1 percent) with Private Employers leading the way, growing by 1,093 (2.4 percent). Goods Producers (up 297, 3.1 percent) and Service Providers (up 837, 1.9 percent) shared in the gains.
The MSA lost 3,317 jobs (2.4 percent) in January. Losses were spread among a number of supersectors with the largest numerical decline coming in Trade, Transportation, and Utilities (down 1,090, 3.4 percent) and the largest proportional drop in Mining, Logging, and Construction (down 609, 7.5 percent). For the year the MSA added 6,039 jobs (4.6 percent), with every supersector adding jobs during the prior 12 months.
The MSA also lost jobs in January, shedding 1,266 (2.2 percent) over the month. The only two supersectors to add employment were Information and Professional and Business Services which were up by 1.5 percent and 0.7 percent, respectively. Combined, they added just 30 jobs. As was normal, the over-the-year change was more promising with employment expanding by 1,345 (2.4 percent). Trade, Transportation, and Utilities added the most jobs, up 728 (6 percent).
