by Tim O'Neill
November 2018

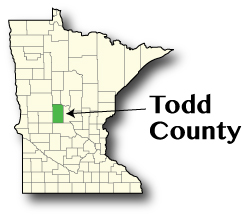
Located in central Minnesota along U.S. Highway 71, Todd County is home to just over 24,500 people. The population of the county ballooned dramatically between 1860 and 1940, fell steadily through the 1970s, and has remained stable through 2017. The county currently ranks as Minnesota's 42nd largest. Long Prairie, with over 3,300 people, is the county's largest city and the county seat.
As of annual 2017 Todd County had 557 establishments supplying 6,463 jobs. Over one in five of these jobs (21.2%) was government employment, significantly higher than the share of statewide jobs in government (13.4%). 93.0% of these government jobs were local government jobs, notably within Educational Services (825 jobs) and Public Administration (415 jobs).
While government employment in Educational Services and Public Administration makes up a significant piece of Todd County's economy, private employment in Manufacturing takes the top spot for most jobs in the county. More specifically, there were just over 1,660 manufacturing jobs in Todd County in 2017, making up over one quarter of the county's total employment. For reference, Manufacturing makes up about one tenth of the state's total employment. With nearly 1,140 jobs, Health Care and Social Assistance is the county's second largest employing industry sector.
After peaking in 2004 Todd County's total employment declined by 8.6 percent (556 jobs) between 2004 and 2016. Nearly all of this loss was made up in a single year, however, as total employment spiked by 9.0 percent (532 jobs) between 2016 and 2017. Virtually all of this growth came from gains in Health Care and Social Assistance with the completion of a new hospital recently in Long Prairie. Growth in health care employment is almost guaranteed to continue into the near future with construction underway on a new community well-being center, also in Long Prairie. Health Care and Social Assistance, making up just under 18 percent of Todd County's total employment, may soon pass Manufacturing as the county's top-employing industry sector.
| Economy | ||
|---|---|---|
| Estimates | Todd County | Minnesota |
| Population | 24,515 | 5,576,606 |
| Labor Force | 13,293 | 3,072,947 |
| Average Unemployment | 2.5% (333 people) | 2.8% (87,117 people) |
| Per Capita Income | $24,410 | $33,225 |
| Cost of Living, Individual | $28,347 ($13.63 per hour) | $31,656 ($15.22 per hour) |
| Cost of Living, Average Family | $47,666 ($15.28 per hour) | $57,624 ($18.47 per hour) |
| Source: DEED Local Area Unemployment Statistics September 2018; DEED Cost of Living in Minnesota 2018; U.S. Census Bureau, 2016 American Community Survey Estimates, 2017 Population Estimates | ||
| Industry | |||||
|---|---|---|---|---|---|
| Top Industries of Employment | 2017 Annual Data | 2012 – 2017 Percent Change | |||
| Number of Firms | Number of Jobs | Average Wage | Employment | Average Wage | |
| Total, All Industries | 557 | 6,463 | $39,260 | 521 (8.8%) | 23.8% |
| Educational and Health Services | 65 | 1,961 | $46,644 | 366 (22.9%) | 30.9% |
| Manufacturing | 38 | 1,663 | $49,088 | 190 (12.9%) | 15.8% |
| Trade, Transportation, and Utilities | 154 | 989 | $25,896 | -27 (-2.7%) | 5.7% |
| Public Administration | 27 | 455 | $38,376 | -14 (-3.0%) | 21.0% |
| Source: DEED Quarterly Census of Employment and Wages (QCEW) | |||||

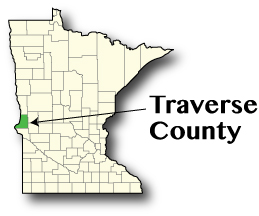
After an hour and a half of driving west from Long Prairie on Minnesota Highway 27, you would drive into the City of Wheaton, the county seat of Traverse County. Making up the northern half of the distinctive bump on Minnesota's western border with North Dakota, Traverse County is also noted for being the state's least populated county. While the county's population grew steadily between 1870 and 1910, the population plateaued through 1950, before steadily declining through 2017. According to the Minnesota State Demographic Center, 3,333 people called Traverse County home in 2017. Just over 60 percent of the county's population lives in its four cities: Browns Valley, Dumont, Tintah, and Wheaton.
Traverse County's population is considerably older than Minnesota's population overall. As of 2017, over one quarter (25.3 percent) of the county's population was 65 years of age and older. Comparatively, 15.4 percent of Minnesota's population is 65 years of age or older. Interestingly, all age cohorts witnessed declines in Traverse County between 2000 and 2017, except for those between the ages of 55 and 64. The Minnesota State Demographic Center projects Traverse County's total population to decline by 23.0 percent between 2020 and 2030, equivalent to approximately 700 people.
As of annual 2017 Traverse County had 143 establishments supplying 1,169 covered jobs. As such, Traverse County is Minnesota's 86th largest-employing county, beating out Red Lake County which had 1,025 covered jobs. Zooming in on industry employment, Health Care and Social Assistance with 178 jobs just beat out Retail Trade with 172 jobs to be Traverse County's largest-employing sector. Other major sectors with over 100 jobs in the county include Public Administration (148 jobs), Wholesale Trade (130 jobs), and Educational Services (115 jobs).
Within the past five years, between 2012 and 2017, Traverse County employment grew by 8.5 percent. Growth was led by Agriculture, Public Administration, Retail Trade, Educational Services, and Wholesale Trade. Health Care and Social Assistance employment declined by 22.3 percent during this time.
| Economy | ||
|---|---|---|
| Estimates | Traverse County | Minnesota |
| Population | 3,319 | 5,576,606 |
| Labor Force | 1,763 | 3,072,947 |
| Average Unemployment | 2.0% (36 people) | 2.8% (87,117 people) |
| Per Capita Income | $30,992 | $33,225 |
| Cost of Living, Individual | $25,465 ($12.24 per hour) | $31,656 ($15.22 per hour) |
| Cost of Living, Average Family | $44,212 ($14.17 per hour) | $57,624 ($18.47 per hour) |
| Source: DEED Local Area Unemployment Statistics September 2018; DEED Cost of Living in Minnesota 2018; U.S. Census Bureau, 2016 American Community Survey Estimates, 2017 Population Estimates | ||
| Industry | |||||
|---|---|---|---|---|---|
| Top Industries of Employment | 2017 Annual Data | 2012 – 2017 Percent Change | |||
| Number of Firms | Number of Jobs | Average Wage | Employment | Average Wage | |
| Total, All Industries | 143 | 1,169 | $34,580 | 92 (8.5%) | 14.3% |
| Trade, Transportation, and Utilities | 42 | 358 | $38,584 | 13 (3.8%) | 11.7% |
| Educational and Health Services | 13 | 292 | $30,576 | -40 (-12.0%) | 8.5% |
| Public Administration | 9 | 148 | $37,700 | 1 3 (9.6%) | 22.7% |
| Natural Resources and Mining | 22 | 99 | $39,416 | 23 (30.3%) | 8.8% |
| Source: DEED Quarterly Census of Employment and Wages (QCEW) | |||||

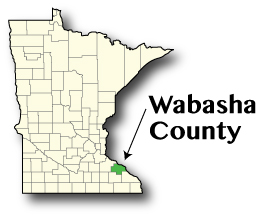
Drive east and south from Wheaton, and you will enter the county seat of Wabasha County, also named Wabasha, in just under five hours. A part of the Rochester Metropolitan Statistical Area (MSA), Wabasha County shares borders with Goodhue, Olmsted, and Winona counties. The Mississippi River shapes the county's eastern border.
Established in October, 1849, Wabasha County as well as the City of Wabasha are named after Sioux Chief Waa-Pa-Shaw. Wabasha County was one of the first large counties formed in the Minnesota Territory, but was significantly reduced in size when Minnesota became a state in 1858. The City of Wabasha, first settled in 1826, is Minnesota's oldest city. Today an estimated 2,453 people live in the City of Wabasha with 21,273 living in Wabasha County.
Wabasha County makes up a unique part of the 11-county Southeast Planning Region of Minnesota. At surface level the county only makes up 2.8 percent of the region's total 242,674 jobs. And what is the Southeast Planning Region especially known for? Health Care and Social Assistance. With nearly 64,000 jobs this industry makes up over one quarter of the region's total employment. Zooming in, seven of every 10 health care jobs in Southeast Minnesota are in Olmsted County (if you want to learn more about Olmsted County, check out the May 2018 issue of Employment Review). But this is about Wabasha County.
While there are over 800 Health Care and Social Assistance jobs in Wabasha County, the county has much higher concentrations of employment in Transportation and Warehousing, Public Administration, and Manufacturing. For instance, where Wabasha County makes up 2.8 percent of Southeast Minnesota's total employment, it makes up 5.6 percent of the region's employment in Transportation and Warehousing. Where the county has over 800 Health Care and Social Assistance jobs, it has over 1,500 manufacturing jobs. While manufacturing employment has declined in Wabasha County since 2005, recent trends show more stability in the industry sector. Recent investments in Fabricated Metal Product Manufacturing in Lake City may account for some of this.
| Economy | ||
|---|---|---|
| Estimates | Wabasha County | Minnesota |
| Population | 21,608 | 5,576,606 |
| Labor Force | 11,905 | 3,072,947 |
| Average Unemployment | 2.0% (237 people) | 2.8% (87,117 people) |
| Per Capita Income | $31,464 | $33,225 |
| Cost of Living, Individual | $28,808 ($13.85 per hour) | $31,656 ($15.22 per hour) |
| Cost of Living, Average Family | $49,026 ($15.71 per hour) | $57,624 ($18.47 per hour) |
| Source: DEED Local Area Unemployment Statistics September 2018; DEED Cost of Living in Minnesota 2018; U.S. Census Bureau, 2016 American Community Survey Estimates, 2017 Population Estimates | ||
| Industry | |||||
|---|---|---|---|---|---|
| Top Industries of Employment | 2017 Annual Data | 2012 – 2017 Percent Change | |||
| Number of Firms | Number of Jobs | Average Wage | Employment | Average Wage | |
| Total, All Industries | 565 | 6,693 | $36,348 | -153 (-2.2%) | 11.7% |
| Manufacturing | 30 | 1,538 | $45,812 | -199 (-11.5%) | 0.7% |
| Educational and Health Services | 61 | 1,381 | $38,532 | 55 (4.1%) | 16.1% |
| Trade, Transportation, and Utilities | 135 | 1,373 | $35,724 | -16 (-1.2%) | 18.1% |
| Leisure and Hospitality | 72 | 700 | $13,936 | -75 (-9.7%) | 39.6% |
| Source: DEED Quarterly Census of Employment and Wages (QCEW) | |||||

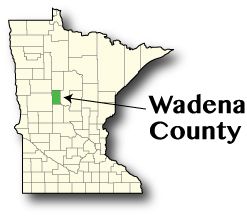
The alphabetical driving tour of this month's four counties is not the most efficient route to take. Nonetheless, our final journey takes us from one appropriately named county seat, Wabasha of Wabasha County, to another, Wadena of Wadena County. The journey cuts northwest into central Minnesota, and should take just over four hours. Fortunately, according to DEED's Quarterly Census of Employment and Wages (QCEW), Wadena has three hotels within city limits for travelers to choose from when they arrive. For the more adventurous, checking out and setting up camp in the Huntersville or Lyons State Forests is always an option, too.
Organized in February, 1873, Wadena County's population grew rapidly between 1880 and 1940. During those six decades, the county added nearly 10,700 people, growing by an annual average of 8.6%. Between 1940 and 2017, however, the county's total population grew by less than 1,000 people, hitting 7.5% growth for that entire span of 77 years. More recently, between 2000 and 2017, growth has been highest for those between 55 and 74 years of age. Overall, Wadena County's population is older than the state's population, with a median age of 41.6 years in the county compared to 37.9 years in Minnesota.
With an aging population and little to no in-migration, Wadena County faces the same challenge that Todd, Traverse, Wabasha, and most other counties in Minnesota face: how to keep growing. Since 2009 Wadena County's labor force size has dropped from a high of 6,729 people to 5,548 people. At the same time, the number of unemployed persons has fallen to a record low. In light of such trends employers in the county may find it increasingly difficult to find new people for available job postings.
| Economy | ||
|---|---|---|
| Estimates | Wadena County | Minnesota |
| Population | 13,669 | 5,576,606 |
| Labor Force | 5,548 | 3,072,947 |
| Average Unemployment | 3.2% (179 people) | 2.8% (87,117 people) |
| Per Capita Income | $22,283 | $33,225 |
| Cost of Living, Individual | $27,389 ($13.17 per hour) | $31,656 ($15.22 per hour) |
| Cost of Living, Average Family | $46,509 ($14.91 per hour) | $57,624 ($18.47 per hour) |
| Source: DEED Local Area Unemployment Statistics September 2018; DEED Cost of Living in Minnesota 2018; U.S. Census Bureau, 2016 American Community Survey Estimates, 2017 Population Estimates | ||
| Industry | |||||
|---|---|---|---|---|---|
| Top Industries of Employment | 2017 Annual Data | 2012 – 2017 Percent Change | |||
| Number of Firms | Number of Jobs | Average Wage | Employment | Average Wage | |
| Total, All Industries | 407 | 5,386 | $37,180 | -241 (-4.3%) | 11.2% |
| Educational and Health Services | 55 | 2,064 | $39,624 | -363 (-15.0%) | 4.7% |
| Trade, Transportation, and Utilities | 97 | 1,279 | $35,048 | -51 (-3.8%) | 7.0% |
| Manufacturing | 27 | 489 | $41,600 | -23 (-4.5%) | 25.4% |
| Public Administration | 17 | 367 | $39,728 | 85 (30.1%) | 8.4% |
| Source: DEED Quarterly Census of Employment and Wages (QCEW) | |||||