by Dave Senf
October 2015
Note: All data except for Minnesota's PMI have been seasonally adjusted. See the feature article in the Minnesota Employment Review, May 2010, for more information on the Minnesota Index.
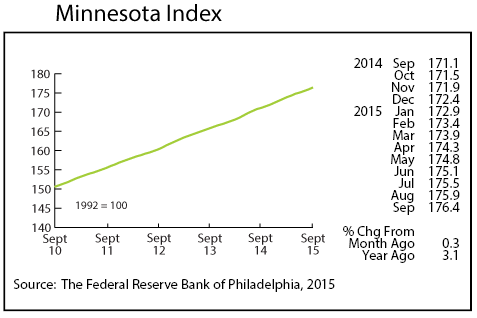
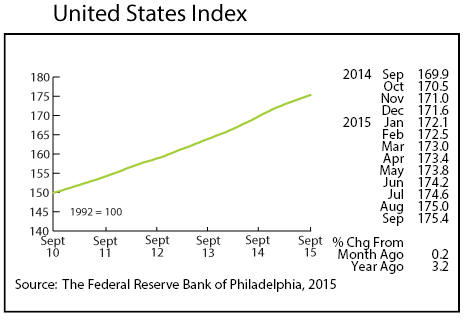
After four straight months of 0.2 percent increases, the Minnesota Index climbed 0.3 percent in September. The index picked up speed despite the largest wage and salary employment drop in 12 months. Job loss was offset by an uptick in weekly manufacturing hours and a decline in the unemployment rate. The U.S. index advanced 0.2 percent for the sixth straight month. Minnesota's index advanced faster than the U.S. index for the second straight month. Minnesota's index is up 3.1 percent over the year compared to the 3.2 gain recorded by the U.S. index.
Adjusted Wage and Salary Employment declined by 5,700 jobs in September with most of the loss in the private sector. September's drop was the largest since last September. Private sector payrolls fell by 5,400 jobs while public sector payrolls were trimmed by 300 jobs, both seasonally adjusted. Job cutbacks were highest in Other Services, in Educational and Health Services, in Trade, Transportation, and Utilities, and in Construction. Payroll numbers expanded only in Professional and Business Services and in Leisure and Hospitality.
Manufacturing has lost jobs for five straight months, the longest losing streak since 2009. A slowing global economy along with a stronger dollar seems to be taking a toll on Minnesota manufacturers. Trade, Transportation, and Utilities has also lost jobs over the last four months which also hasn't occurred since 2009. The 2,500 drop in Other Services employment is likely to be revised lower as September's plunge was the largest on record.
Minnesota's unadjusted over-the-year job growth was 1.2 percent in September, the lowest annual gain since January 2014. The U.S. rate also dropped to 1.9 percent, its lowest rate since last January. Minnesota's job growth has lagged behind U.S. growth for nine months in a row.
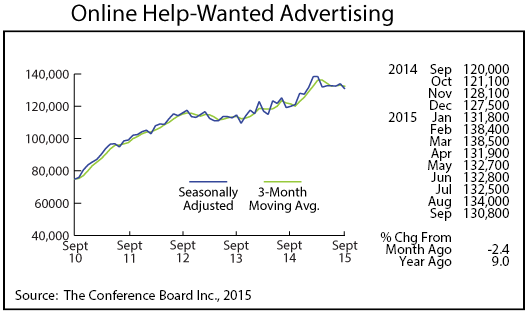
Minnesota's adjusted online Help-Wanted Ads ticked down 2.4 percent in September. U.S. online advertising also fell, inching down 2.6 percent. Online job ads are up 9.0 percent in Minnesota compared to 12 months ago, suggesting that labor demand remains robust in the state. Online help-wanted ads nationally are up 5.0 percent from a year ago.
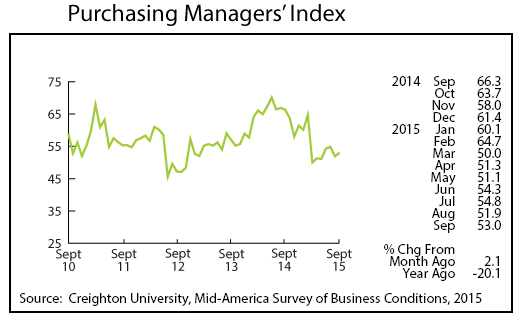
Minnesota's Purchasing Managers' Index (PMI) bounced up in September to 53.0. Minnesota's PMI index continues to come in higher than the U.S. (50.2) and Mid-American (47.7) indices. Both of these indices fell in September. A PMI above 50 indicates an expansionary economy, and a reading below 50 suggest a sluggish economy over the next three to six months. Minnesota's index is pointing towards moderate economic expansion for the rest of the year.
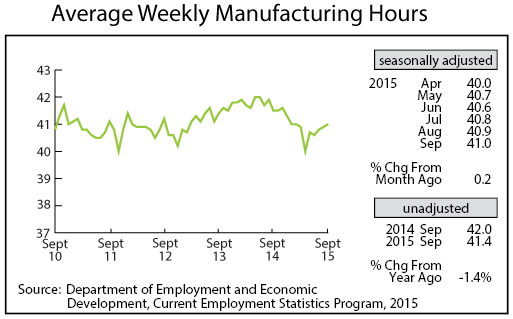
Adjusted Manufacturing Hours climbed for the third month in a row to 41.0 in September. The factory workweek hasn't been this high since February. The longer factory workweek is consistent with a higher PMI but inconsistent with falling manufacturing employment.
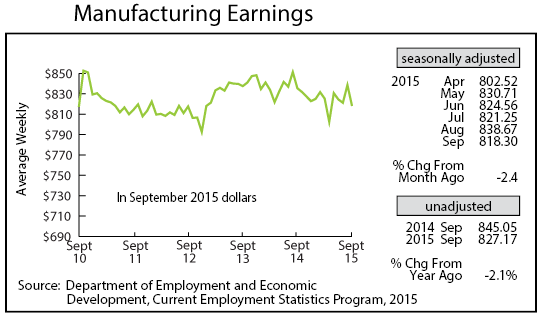
Manufacturing Earnings, after accelerating sharply in August, dropped sharply in September, falling to $818.30, the smallest paycheck in over three years.
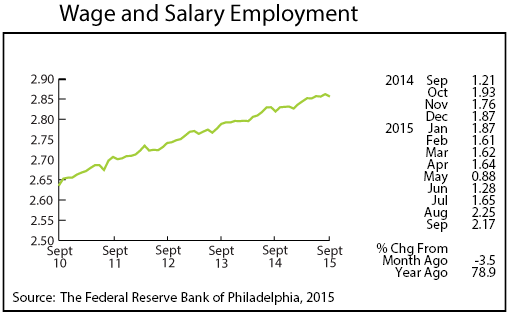
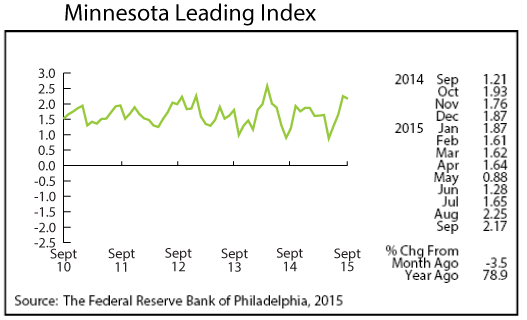
After reaching an18-month high last month, the Minnesota Leading Index slipped slightly in September to 2.17. The index has average 1.65 since 2010 so the 2.17 reading suggests that Minnesota's economic growth over the next six months will be above the average rate achieved over the last five years. Minnesota's leading index has been running above the U.S. leading index for the last three months, implying that economic growth in Minnesota will be stronger than nationally during the last few months of 2015 and the first few months of next year.
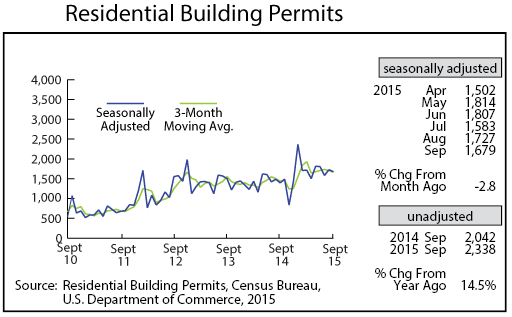
Adjusted Residential Building Permits dipped slightly in September to 1,679 but on an unadjusted basis were 20.3 percent higher than a year ago. Residential permits have totaled 13,536 through September compared to 11,359 over the same period last year. That is a 19.1 percent increase in permit activity in 2015 compared to 2014.
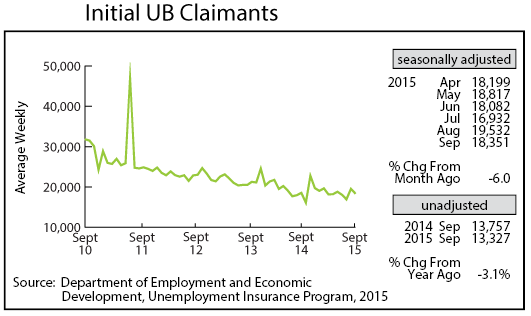
Adjusted Initial Claims for Unemployment Benefits (UB) dropped in September to 18,351. As of September, initial claims have averaged 0.69 percent of total wage and salary employment. That is the fourth lowest average over the last 45 years. Only the boom years of 1998, 1999, and 2000 have recorded lower levels. The highest levels were recorded in 1975, 1980, 1982, and 2009. Those were all recession years while the boom years were periods of tight labor markets with low unemployment and labor shortages across many industries. Labor shortages are developing in Minnesota which may be acting as a drag on job growth.
