by Dave Senf
February 2015
Note: All data except for Minnesota's PMI have been seasonally adjusted. See the feature article in the Minnesota Employment Review, May 2010, for more information on the Minnesota Index.
The Minnesota Index, U.S. Index and Minnesota Leading Index are generated by the Philadelphia Federal Reserve Bank. All three indices are in the process of being reviewed and are unavailable until the reexamination is complete.
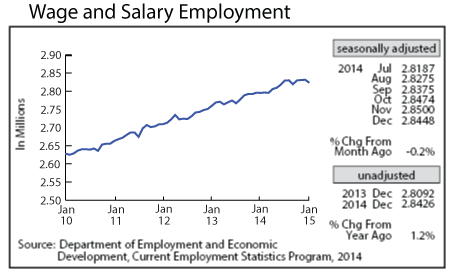
Adjusted Wage and Salary Employment was benchmarked for 2014 this month with significantly downward revisions occurring. Job growth for 2014 on an annual average basis tailed off to 1.3 percent from previous estimate of 1.7 percent. January's wage and salary employment continued the downward trend with 7,900 jobs lost. Trade, Transportation, and Utilities accounted for a large share of the job loss followed by Construction and Information. Professional and Business Services and Educational and Health Services added the most jobs, offsetting some of the job decline in other sectors.
Minnesota's 1.3 percent job growth in 2014 was down substantially from the 1.7 percent average of the previous three years. While Minnesota's job growth slowed, national job growth jumped to 1.9 percent. The state's job picture improved faster than the national picture after the Great Recession but has cooled off compared to the national situation over the last few years. Minnesota's slower job growth may be labor supply related. Labor demand still appears to be strong, and the layoff rate remains subdued. Minnesota's unemployment rate remains significantly below the U.S. rate, implying that Minnesota's pool of unemployed is much smaller than nationally, creating a headwind for job growth in the state.
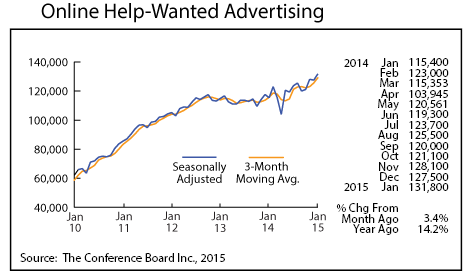
Labor demand remains robust in Minnesota as evidenced by the increase in adjusted online Help-Wanted Ads. Help-wanted advertising, a proxy for labor demand, continues to head up. January's level was up 14.2 percent from a year ago. Minnesota's share of national help-wanted online advertising remains solid at 2.5 percent compared to the state's 2.0 percent of employment.
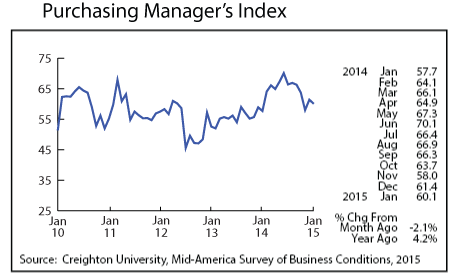
Minnesota's Purchasing Managers' Index (PMI) slipped for the fifth time in the last six months but remains well above the growth neutral 50 reading. Minnesota's index (60.1) continues to top both the U.S. index (53.5) and Mid-American Index (54.8) in January. Slower job growth in Minnesota is inconsistent with this indicator.
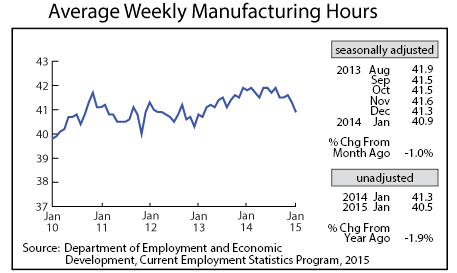
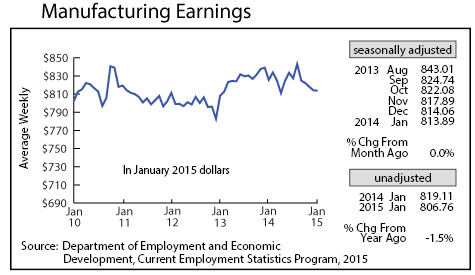
Plunging adjusted Manufacturing Hours for the second month in a row is, however, consistent with slowing job growth. Minnesota's factory hours declined to below 41 hours for the first time in two years. January's Manufacturing Earnings were essentially unchanged from December but were down 1.5 percent in inflation adjusted terms from a year ago.
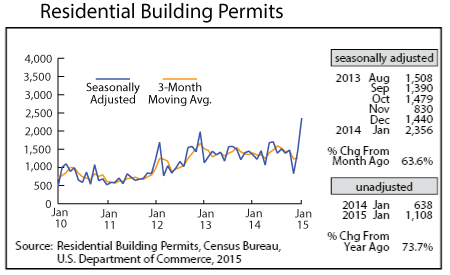
Adjusted Residential Building Permits surged for the second straight month reaching 2,356. This is the highest monthly total since April 2006. The adoption of new building codes may be behind the surge as builders speed up their permitting activities to beat the building code changes.
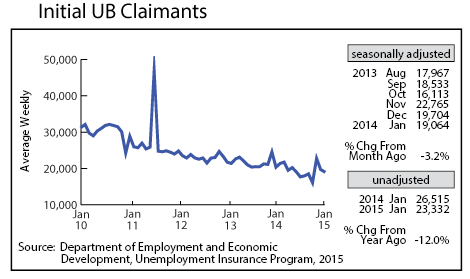
Adjusted Initial Claims for Unemployment Benefits (UB) tumbled for the second month in a row in January after spiking in November. Initial claims on an unadjusted basis were 12.0 percent lower than a year ago. Job growth has been higher in the past when initial claims were this low.
