by Dave Senf
November 2019
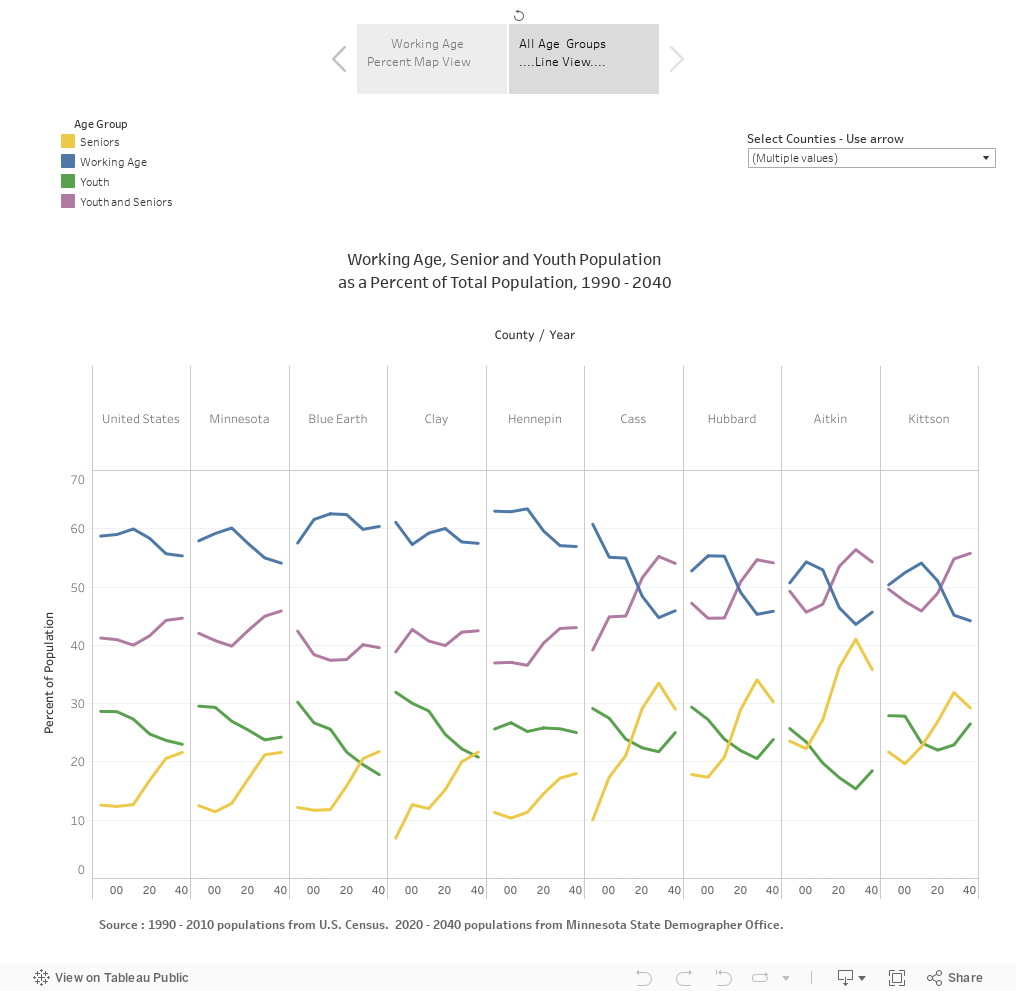
Last time Fun With Statistics looked at the age distribution of each county’s workforce and age distribution of each sector’s workforce age distribution for each county. This time around the age distribution of each county total population is looked at historically and projected with county population divided into three age groups (Youth –19 years old and under, Working Age – 20 to 64 years old, and Seniors – 65 years and older). The Youth and Senior age groups are also added together to show which counties have or will have a higher percent of its population in Youth and Seniors ages than in Working Age. This concept is known as the dependency ratio.
Minnesota had 19 counties in 1990 where the Youth and Senior populations exceeded Working Age population. In 2000 and 2010 only one county had the above situation. Six counties are projected to have a higher dependency population than Working Age population by 2020 with than number jumping to 39 counties in 2030 and 48 counties in 2040.