by Dave Senf
December 2019
As Millennials have moved into the workforce over the last two decades, comparison to prior generations have become common. Education attainment, marriage status, employment, earnings, wealth, and spending habits have all been examined to gauge how Millennials have been faring compared to older generations.1
Many of the generational comparisons reach conflicting conclusions primarily because there are several key variables to account for over time, in particular changing household size and cost of living. Accounting for relative changes in housing cost, higher education costs, and health care cost are particularly challenging. This article doesn’t attempt to settle the “things were better in the old days” debate. Instead the U.S. Census Bureau’s Quarterly Workforce Indicator (QWI) data are used to give a broader view of how the distribution of employment and wage payments across age groups have shifted with the changing of generations.
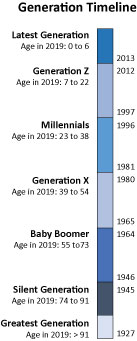
Generation boundary dates used here are displayed in Figure 1 as generation definitions often vary.2 Based on these definitions Minnesota’s 2018 generation labor force mix was 7 percent for Generation Z, 32 percent for Millennials, 35 percent for Generation X, 24 percent for Baby Boomers, and 2 percent for the Silent Generation and a handful of Greatest Generation individuals still holding down jobs.3 Baby Boomers made up the bulk of the workforce in the 1990s and early 2000s as they reached their peak labor force participation rates and also as a result of their numbers being larger than the generations before and after them, the Silent and X generations (see Figure 2).
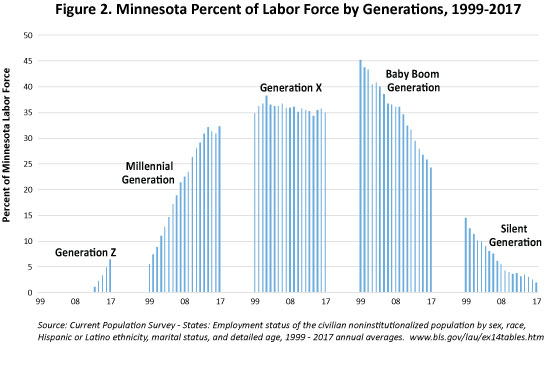
Generation X replaced Baby Boomers as the leading source of workers around 2010 as they reached peak labor force participation years, and the oldest Baby Boomers started to retire. Generation X’s time as the top provider of workers will soon be over as the youngest Millennials reach their top labor force participation years (35 – 55 years old). Some studies which use early birth dates for Millennials already show Millennials as the largest generation in the labor force in Minnesota.
Baby Boomers’ share of the workforce will continue to slip, but this generation will remain a source of workers longer than the Silent Generation as more Baby Boomers are delaying retirement compared to their parents. Future labor force participation as projected by the Bureau of Labor Statistics predicts participation rates for 65 to 74 years old to climb to 32.5 percent in 2028 from 27.0 in 2018 and to 12.1 from 8.7 percent for 75 years and older.4
Three generations – Generation Z, Millennials, and the Silent Generation – currently receive a smaller slice of the state’s total wage and salary payments relative to their slice of the employment pie. Millennials captured roughly 28 percent of Minnesota wage and salary payment in 2017 but accounted for 34 percent of employment. The disparity between pay and employment is highest for Generation Z as they held 6 percent of jobs in 2018 but received only 1.3 percent of wage and salary payments. The Silent Generation held 1.7 percent of all employment and in turn received 1.3 percent of wage payments (Figure 3).
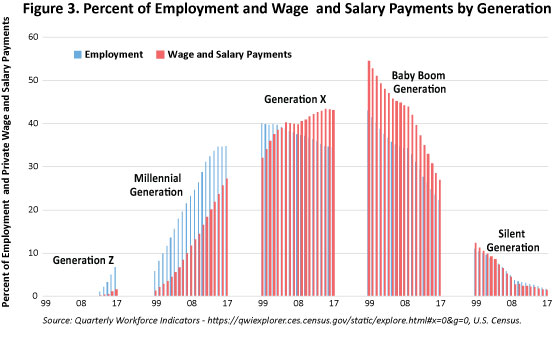
Most of the disparity in employment and wage and salary payments percentages is a function of how the pay scale and hours worked varies across age groups. Wages and salaries tend to increase as workers age and their skills and experience levels increase. Hours worked also increase with age before tailing off near retirement age. Older and younger workers are more likely to hold part-time jobs than other age groups.
Generation X didn’t achieve a higher share of wage and salary payments than employment share until 2005 when the oldest Xers reached 40. As more Generation X workers reached their peak earnings years (late 40s to early 50s) over the last decade, wage and salary payments shares have increased relative to employment shares. Baby Boomers still receive a higher share of the state’s wage and salary pie than their slice of the employment pie, but the gap has been shrinking over the last decade as most Baby Boomers have passed their peak earnings years and their wages have either stagnated or decreased relative to younger workers.
Figures 4 displays quarterly private sector wage and salary payments in Minnesota between 1995 and 2018 by age groups. Minnesota’s 2.5 million private sector wage and salary employees received roughly $35 billion in wages and salary during the second quarter of 2018.
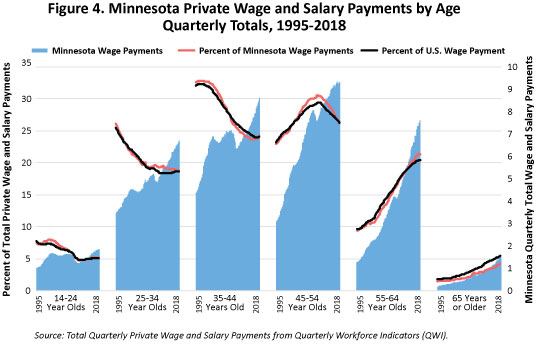
Almost of third of the $35 billion went to 45 – 54 year old workers. Younger (14 – 24 year olds) and older (65 years and older) workers received 5.2 and 4.2 percent of the state’s private sector wages and salary payments. Less employment, lower wages, and shorter hours worked add up to smaller slices the of wage and salary pie for younger and older workers. The magnitude of the wage payment decline around the Great Recession by age groups is detailed in Figure 4. The least affected age groups were the 55 – 64 year olds and 65 years and older workers. Their combined wage payments show the smallest drops percentage-wise from 2008 to 2010.
The movement of the Baby Boomer generation through the labor force in terms of share of wages received is highlighted by the peak in wage share received by 45 - 54 years old workers around 2008. The middle of the Baby Boomers turned 50 around then, reaching their peak labor force participation years.
Minnesota’s labor force as well as the U.S. labor force has continued to age over the last decade as shown by the increasing share of wage payments received by workers older than 55 years. Minnesota’s wage payment shares by age groups for the most part have mirrored national trends as Minnesota’s age structure is similar to that of the U.S. The one noticeable difference is that 65 years and older workers in Minnesota are receiving a smaller share of wage payments than nationally. That may be the result of older Minnesota’s being better positioned to retire than fellow senior citizens across the nation.
Underlying the trends shown in Figures 3 and 4 are wage and salary variation across age groups. Average monthly wage and salary payments for 19 – 21 year old workers in 2018 were $1,026 or $14,500 annually, while average monthly wage and salary payments for 45- 54 year old workers were $5,830 or $70,000 annually. The overall average monthly wage across all workers was $4,440 or $53,300. Thus 19 – 21 year old workers’ average monthly wage in 2018 was roughly 73 percent lower than the average overall monthly wage while the average monthly wage for 45 – 54 year old workers was 30 percent higher than the overall average (see Figure 5).
Relative median hourly wages are also reported in Figure 5 across age groups.5 The overall median wage in the fourth quarter 2018 was $20.20. The median hourly wage for 19- 21 year old workers was $12.66 or 37 percent below the overall median. The median hourly wage for 45 – 54 year old workers was $26.12 or 29 percent higher than the overall median wage.
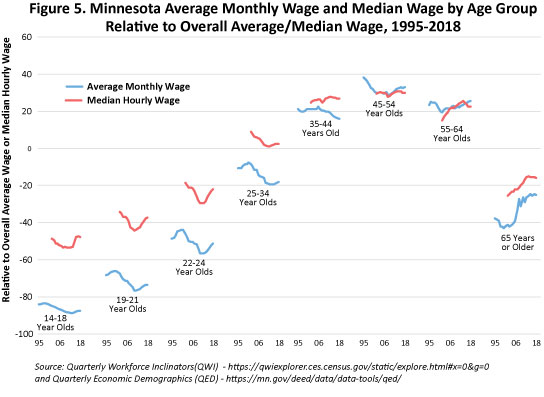
Both wage measures show the same trend over the last two decades. Relative wages for the three youngest age groups declined from the mid-90s right through the Great Recession but have been climbing since. Relative wages for 24 – 34 year old workers also tailed off from 1995 to 2009 but have been flat over the last decade. Relative wages haven’t changed all that much for the three age groups that include 35 – 64 year olds.
The only age group of workers to show a sustained relative wage gain has been 65 years or older workers. That likely reflects more educated and higher paid Baby Boomers replacing their parents in the 65 years or older workforce. Workers younger than Baby Boomers are more educated as a group than Baby Boomers but have not seen their relative wages increase until recently.
The wage data linked to age groups and examined over time here point to younger generations receiving lower wages relative to overall wages for most of the past two decades. Relative wages have been improving recently but still have some ways to go before reaching the same relative wages that younger workers were paid 20 years ago.
1Recent intergenerational comparisons include: Millennial life: How young adulthood today compares with prior generations, Pew Research Center and Are Millennials Different?, Federal Reserve Board.
2The generation dates used here are based on the Pew Research Center work cited in footnote 1.
3Annual labor force statistics are published in five-year age brackets which prevents precise generation of labor force and other labor market estimates from being established.