by Amy Gehring
February 2013
When individuals lose their jobs, one option is to seek further education, be it to expand or to update existing skills or to learn a new field. Thus, it makes sense when unemployment increases, so does enrollment in post-secondary institutions. The increase in enrollments is a two-pronged effect, precipitated by actual unemployed people returning to school and the motivation of the general population to get ahead of the storm. To what extent can new enrollments in post-secondary institutions be predicted by looking at area unemployment rates?
Each fall post-secondary institutions in Minnesota send enrollment data to the Office of Higher Education (OHE). Enrollment data are thus a snapshot in time. To find new enrollments for this study, all students classified as transfers, continuing, or re-admitted were excluded from the data set. Also, in this study, state of residence was limited to Minnesota only to concentrate on the unemployment rates within the state.
A greater number of females enroll every year, yet the difference between males and females in enrollment does not vary substantially throughout the eight years of this study. In fall 2003 whites made up 86 percent of new enrollees and by 2010, this number was down to 80 percent. This is not a large decrease and may be part of a larger trend completely unassociated to unemployment rates. During this time blacks increased new enrollments from 5 to 7 percent, and others increased from 9 to 13 percent. Included in 'other' are Hispanics, who still represent 4 percent - a small percentage - of new enrollments.
Roughly 70 percent of new enrollees are classified as "Degree Seeking", meaning they intend to complete a degree, diploma, or certificate. This percentage drops somewhat at the onset of the recession.
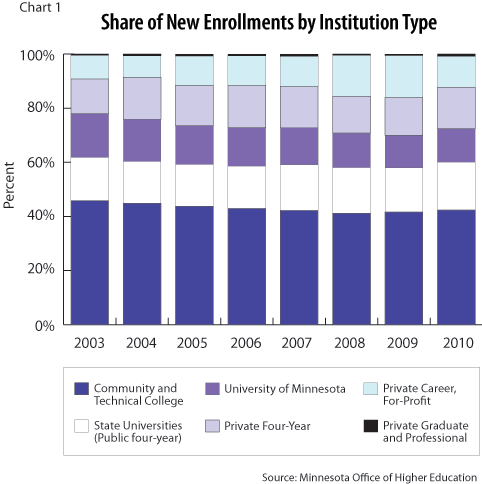
The types of institutions in which students enroll changed somewhat (Chart 1). The schools in the Minnesota State Colleges and Universities system - community and technical colleges and four-year state universities - make up about three-fifths of total enrollment. This share is being cut into mostly by private career, for-profit institutions. From fall 2003 to fall 2009 Minnesota State Colleges & Universities schools went from 62 percent of new enrollees to 58 percent. This four percent decrease in share comes mostly from students enrolling in private schools, which went from a share of nine percent in 2003 to 16 percent in 2009. Again, this may be a part of an overall trend.

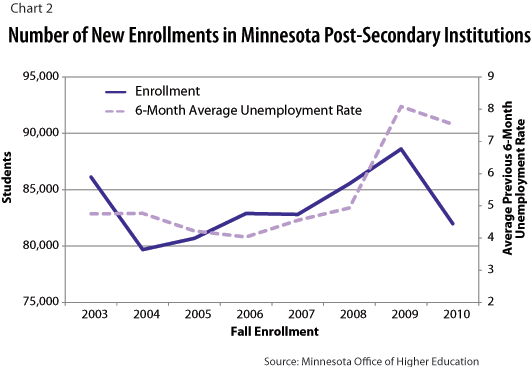
The number of new enrollments in Minnesota's post-secondary institutions increased from 2003 to 2010 (Chart 2). During this same period seasonally adjusted unemployment rates in Minnesota reached a high of 8.9 percent in May and June 2009. Chart 2 shows that both unemployment rates and new enrollments increased during the recession and began to decrease at the same time.
Chart 2 seems to show a clear relationship between unemployment and new enrollments as they both trend upward in the same time period. However, if you look carefully at correlations among the two variables, you see that there is more involved in this relationship. As in Chart 2, the following analysis is based on the average adjusted unemployment rate from the months of January through June of the year preceding fall enrollment. The six-month average unemployment rate was used in order to gauge fully the tenor of the job market in the time period before fall enrollment.

The Pearson coefficient measures the correlation between two continuous variables. The coefficient has a range of -1 to +1, with larger absolute values indicating stronger correlations. The sign of the coefficient indicates the direction of the correlation: Positive values mean that as one variable increases, so does the other. The Pearson coefficient measuring the linear relationship between unemployment and new enrollment is 0.462, a moderately strong, positive relationship. This means as the unemployment rate rises, so does the number of new enrollees.
In addition to the coefficient, the correlation measure also estimates the chances the relationship is real, versus similarities that come purely from chance. It does this by estimating the p-value. If it is less than or equal to .05 (five percent), the result is considered real and the correlation is statistically significant. Here there is an 83 percent chance of no-significance. So even though the correlation coefficient shows a moderately strong relationship, there is a strong probability this relationship is from chance alone.
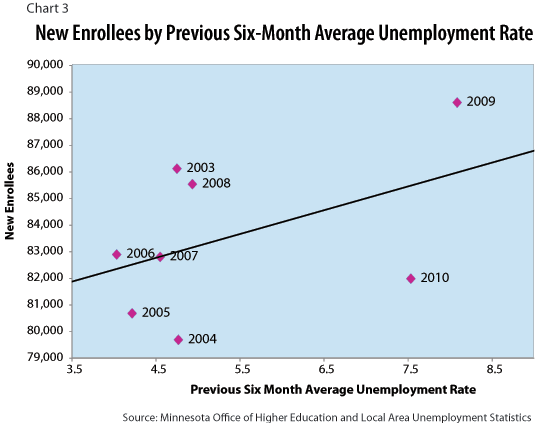
Chart 3 represents the correlation between unemployment and new enrollment. This is a scatterplot of the intersections of the variables by year. If there were a stronger relationship, the points would be more tightly grouped along the straight line. Yet there is a general upward trajectory, represented in the trend line showing the positive slope of the relationship. This trend line is calculated using regression analysis and the linear equation: Y = a + bX.
In this case Y (the dependent variable) is new enrollment, and X (the independent variable) is the unemployment rate. The value of Y (new enrollments) depends on the value of X (unemployment rate). Using the regression coefficients, if the unemployment rate is 9.0, the new enrollments would equal roughly 87,000 students. Yet, looking at Chart 3, if higher education used this formula to predict fall enrollments, they would have been expecting 3,500 more new enrollees in fall 2010 than there were.
This discrepancy occurs because there are many more variables affecting new enrollments than just the unemployment rate. The Analysis of Variance (ANOVA) calculates how much of the variation in new enrollments comes from the regression equation. Using unemployment rates accounts for only 21 percent of the total variance in new enrollments. Thus, unemployment helps in predicting the number of new enrollments, but the help is minimal.

Since the regression equation explains only one-fifth of the variability in new enrollments, more factors must be included in the analysis. One such intervening variable is geographical location in Minnesota. Running correlations by planning regions reveals that only one area in Minnesota has a statistically significant relationship between unemployment rates and new enrollment - the northwest region. With a Pearson coefficient equal to 0.755, this is a fairly strong, positive relationship, and there is only a 3 percent probability this correlation is from chance alone. In the northwest region, unemployment rates explain 57 percent of the variation in new enrollments, compared to only 21 percent statewide. While other planning regions also had positive relationships, they were neither strong nor significant.
Another variable to include in the analysis is the type of post-secondary institutions available. If people react to unemployment rates by enrolling in only one type of school, this could explain the high variability in the equation. In fact, only public, four-year state universities have a significant relationship between new enrollment and the unemployment rate. More than half of the variation in new enrollments for state universities can be explained by the unemployment rate. Both private four-year and private graduate and professional institutions actually have a negative association, meaning when unemployment rates increase, new enrollments decrease. These associations are not significant, however, and therefore could be from chance.
To this point, we have measured the correlation between new enrollments and the statewide or planning region unemployment rates, but not an individual's connection to job loss. People may decide to enroll in post-secondary education for the sake of expediency but also if they become unemployed. Yet the number of new enrollees with Unemployment Insurance initial claims in the months preceding their enrollment is quite small. The highest percentage of new enrollees with an initial claim in the three quarters preceding enrollment is five percent in 2009. This isn't a sign of more people enrolling in school, but rather that the overall number of initial claims was very high that year. If we looked at the figures from another angle, we see that between seven and nine percent of people filing initial claims enrolled in post-secondary education between 2003 and 2010, with the exception of 2009 when the number increased to 11 percent.
While enrolling in post-secondary education during hard economic times seems a reasonable option, a relationship between new enrollment and unemployment rates is spurious, according to this research which looks only at Minnesota students. The effect unemployment has is filtered through other variables including region and institution type. Even for people on UI, only a low percentage enrolls in post-secondary education in the months following their initial claim.