Silver Linings in Northeast Minnesota: Where we are and the road ahead
by Erik White
January 2016
Northeast Minnesota has been rocked by bad news about the mining industry over the past year. With more than 1,000 layoffs and three of the six taconite facilities shuttered, the effects of this downturn are well-publicized and wide-ranging. For many towns on the Iron Range, mining companies are the most significant source of wages and help support local businesses. Even in Duluth where the economy is more diversified, the job losses are felt in related supporting industries, such as transportation and manufacturing, which will likely have to reduce their business activity.
Add in the ongoing uncertainty of legislative efforts, and it is hard not to feel the gloom from this industry's decline overshadowing the region. The silver lining in the timing of this industry downturn is that the overall regional economy has rebounded from the recession and is still a market with ample job opportunities.
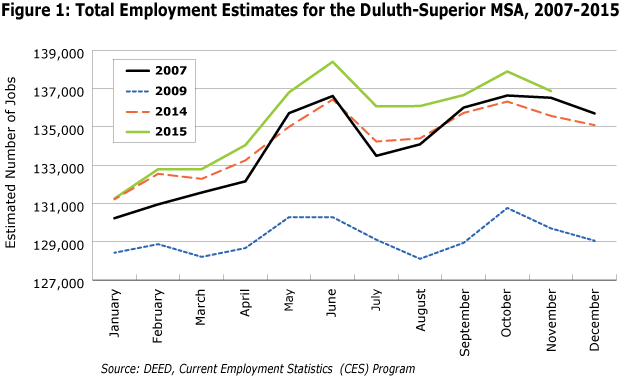
According to Current Employment Statistics, the Duluth-Superior Metropolitan Statistical Area, which includes St. Louis and Carlton County in Minnesota and Douglas County in Wisconsin, reported record high employment estimates every month in 2015. November's estimate of 136,858 jobs was a 1.0 percent increase from a year ago and a 5.5 percent increase in jobs from November of 2009, despite the mining industry layoffs that have occurred in the past 12 months (see Figure 1).

From Slack to Tight
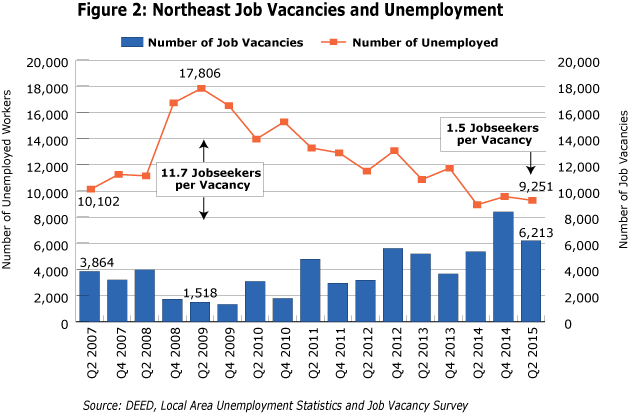
Another indicator of the economic strength in the region is the transformation from a slack to a tight labor market. During the second Quarter of 2009 only 1,518 job vacancies existed in Northeast Minnesota according to DEED's Job Vacancy Survey. At the same time, 17,806 unemployed workers in the region created a ratio of 11.7 jobseekers per job vacancy. That ratio has now dropped to 1.5 jobseekers per job vacancy in the second quarter of 2015, as there were 6,213 job vacancies for just 9,251 unemployed workers in the Arrowhead. The tightening of the labor market has created a new environment for jobseekers and businesses looking to hire (see Figure 2).

One aspect that benefits jobseekers in a tight labor market is the expected increase in wages as businesses compete with one another to attract the limited supply of jobseekers, and evidence from DEED's Job Vacancy Survey supports this dynamic. The median hourly wage offer for all job vacancies in Northeast Minnesota was $11.53 in the Second Quarter of 2015, an increase of $2.04 from just two years ago. Wage offers have steadily increased, even for occupations that typically offer lower pay. For example, food preparation and healthcare support occupations both saw their median wage offers increase by about $2.00 since 2013, building, grounds cleaning and maintenance openings rose about $1.20, and even personal care and service occupations experienced a $0.37 increase (see Table 1).
| Table 1: Northeast Minnesota Median Wage Offers for Job Vacancies, 2013-2015 | |||
|---|---|---|---|
| - | Median Hourly Wage Offer | Q2 2013- Q2 2015 Change | |
| 2nd Quarter 2013 | 2nd Quarter 2015 | ||
| Total, All Occupations | $9.49 | $11.53 | $2.04 |
| Healthcare Support Occupations | $8.88 | $11.23 | $2.35 |
| Food Preparation and Serving Related Occupations | $7.24 | $9.17 | $1.93 |
| Building and Grounds Cleaning and Maintenance Occupations | $7.86 | $9.05 | $1.19 |
| Personal Care and Service Occupations | $9.35 | $9.72 | $0.37 |
| Source: DEED's Job Vacancy Survey | |||
A labor market with nearly as many job vacancies as jobseekers should also see businesses begin to provide not only wage increases, but also other perks that attract and recruit applicants for their open positions, such as hiring bonuses, added vacation and sick leave, flexible scheduling, and on-the-job training. Anecdotally, this has been occurring in the region over the past year as businesses have had to change their playbooks in order to fill their vacant positions and keep their current employees from seeking other opportunities.
Old and Getting Older
While the recovery from the recession and the recent growth in jobs has played a part in the region's economic transformation, another underlying cause is the aging of the population in Northeast Minnesota. Simply put, the region's population is old and getting older.
With the exception of the city of Duluth, median ages in the region are higher than in the state. Table 2 provides age statistics for Northeast Minnesota, showing that Aitkin and Cook Counties have median ages over 50 years, making them the two oldest counties in Minnesota. Just under 50 years, Lake County ranks 5th oldest, Koochiching County is 12th, and Itasca County is 18th, meaning the region is home to 5 of the 18 oldest counties of the 87 in the state. Meanwhile, the city of Duluth has a median age of 33.3 years, which is 4 years younger than the state's median age, reflecting its large college population and the numerous education and job opportunities for young adults in the area (see Table 2).
| Table 2: Northeast Minnesota Age Statistics | |||
|---|---|---|---|
| - | Median Age (years), 2014 | Median Age (years), 2009 | Change in Median Age (years) |
| Aitkin County | 52.6 | 50.5 | 2.1 |
| Carlton County | 40.9 | 40.7 | 0.2 |
| Cook County | 51.2 | 48.6 | 2.6 |
| Itasca County | 45.7 | 44.4 | 1.3 |
| Koochiching County | 47.2 | 46.0 | 1.2 |
| Lake County | 49.5 | 46.9 | 2.6 |
| St. Louis County | 40.8 | 40.6 | 0.2 |
| City of Duluth | 33.3 | 32.2 | 1.1 |
| Minnesota | 37.6 | 37.0 | 0.6 |
| Source: US Census Bureau, 2005-2009 ACS and 2010-2014 ACS | |||
The release of new 2010-2014 five-year estimates from the American Community Survey last December allows for non-overlapping comparison of the previously released 2005-2009 five-year estimates. The data show which counties are getting older faster. Aitkin, Cook, and Lake Counties have had their median ages increase by more than two years since 2009. On the other end of the spectrum, Carlton and St. Louis Counties saw their median ages increase by only 0.2 years in the past five years, while Minnesota's median age increased by 0.6 years during this time frame (see Table 2).
The Age of Retirement
The aging population will have a dramatic effect on labor force availability in the region because those who reach 65 or so may well begin to transition out of the labor force. Although traditionally 65 years old, the age for receiving full social security benefits has recently increased to 67 years old for people born after 1960.
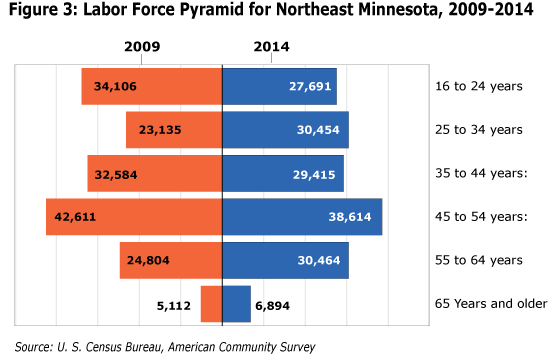
Based on 2014 estimates, there were 30,464 people in the labor force aged 55 to 64 years, who will soon be reaching the age of possible retirement. What's more, with 38,614 people, the 45 to 54 year old age group makes up the largest portion of Northeast Minnesota's labor force and will face the same transition in the following decade (see Figure 3).

Using a labor force pyramid, we can compare the demographic makeup of the region's labor force between time periods and see quickly that the biggest changes that occurred between the time periods were the shift of the youngest workers who moved into the 25 to 34 year old bracket, and the sheer size of the Baby Boom generation, as those workers began progressing into the oldest age group.
At one end of the age spectrum, the number of 25 to 34 years olds in the labor force increased by 31.6 percent, a growth of 7,319 workers. However, most of those gains were offset by the youngest age category – from 16 to 24 years old – which experienced the sharpest decline with a loss of 6,415 people, an 18.8 percent decrease (see Figure 3).
In contrast, the number of workers aged 55 to 64 years old increased by 5,660 people from 2009 to 2014, a 22.8 percent increase. Likewise, despite reaching retirement age, the number of workers aged 65 years and over jumped 34.8 percent, a gain of 1,781 workers. Northeast Minnesota's bottom-heavy labor force pyramid may make it difficult for employers to find the number of workers needed for the jobs in the region. Going forward, a considerable number of people are going to reach the age of retirement, creating a need for replacement workers in addition to new job openings. These trends will likely contribute to a tight regional labor market into the foreseeable future.
New Opportunities
With any challenge comes opportunity, and the region should have plenty of chances to rise to this occasion. Due to high job demand, one important strategy is to engage population groups that have experienced difficulties or barriers to employment in the past. Increasing labor force participation rates and lowering unemployment rates for these groups would have a significant impact on the number of jobs and workers in the region.
Minority unemployment rates are unacceptably high in the region, with the 2010-2014 ACS data showing the unemployment rate of Black or African Americans at 21.2 percent in the Duluth-Superior MSA, while the unemployment rates of Whites over the same time period was 7.3 percent. Similarly, unemployment rates were 18.3 percent for people of Two or More Races and 14.3 percent for American Indian and Alaska Natives, the largest minority group in the region. For people with disabilities, unemployment rates were 17.6 percent, while labor force participation rates were just 40.6 percent (see Table 3).
| Table 3: Employment Characteristics by Race, Hispanic Origin, and Disability, Duluth MSA, 2010-2014 | ||||
|---|---|---|---|---|
| Total Population, 16 years and over | Labor Force Participation Rate | In Labor Force | Unemployment Rate | |
| Race and Hispanic or Latino Origin | ||||
| One race | 225,969 | 62.6% | 141,457 | 7.6% |
| White | 215,313 | 62.9% | 135,432 | 7.3% |
| Black or African American | 2,883 | 50.0% | 1,442 | 21.2% |
| American Indian and Alaska Native | 5,135 | 58.7% | 3,014 | 14.3% |
| Asian | 2,161 | 64.7% | 1,398 | 6.1% |
| Two or more races | 3,940 | 55.3% | 2,179 | 18.3% |
| Hispanic or Latino origin (of any race) | 2,551 | 64.7% | 1,650 | 6.2% |
| Disability Status | ||||
| With any Disability | 19,352 | 40.6% | 7,857 | 17.6% |
| Source: 2010-2014 American Community Survey, 5-Year Estimates | ||||
Bringing the unemployment rate for these minority groups in line with the rate for Whites would help to fill many of the available jobs, while raising labor force participation rates for some of the minority groups and for workers with disabilities would increase the number of available workers. For example, a 14 percentage point drop in the unemployment rate for Black or African American workers would fill 200 jobs, an 11 percentage point rate decline for workers of Two or More Races would equate to 240 jobs, a 7 percentage point drop for American Indians would cover 210 jobs, and bringing the unemployment rate for workers with a disability down to 7.3 percent would fill more than 800 jobs.
Likewise, raising the lower labor force participation rates of Blacks, American Indians, and people of Two or More Races to the 62.9 percent rate held by Whites would add almost 900 new workers to the regional labor force, including 372 Black or African American workers, 299 workers of Two or More Races, and 216 American Indian or Alaska Natives. Matching the state's 51.0 percent labor force participation rate for people with disabilities would add over 2,000 new workers. Businesses in the region that are able to identify, address, and embrace these underutilized groups will likely find more success in meeting their labor force needs.
The Silver Lining
The dark cloud currently hovering over the mining industry is presenting serious hardships that have contributed to an atmosphere of uncertainty for many people and places in the region, and the full impact of the downturn is yet to be altogether realized. Meanwhile, Northeast Minnesota's population is aging, leading to significant changes in the labor force.
However, employment data clearly show that Northeast Minnesota's economy has continued on its path to recovery from the recession, with an historically high number of job vacancies and a tightening labor market as prime examples of the economic transformation. Wage offers are rising for open jobs, and new opportunities are being created that can be filled by workers from different age groups and races that may have struggled to find those opportunities in the past. Going forward, an "all hands on deck" approach will be needed to address the labor force needs of tomorrow.

