


by Steve Hine, Oriane Casale, Amanda Rohrer, Mustapha Hammida and David Senf
June 2014
Five years after the Great Recession, the Minnesota economy continues to make progress, but challenges remain.
It has been five years since the Great Recession officially ended in June 2009, making this recovery slightly longer than the average of 11 post-World War II expansions. In fact, with the announced gain of private sector jobs in May, the U.S. has matched the record for consecutive monthly gains in the private sector at 51 months, equaling the old record set between February 1996 and April 2000.
During this time, Minnesota has also experienced improving labor market conditions, with total jobs, job vacancies, the unemployment rate and layoffs (as measured by new claims for unemployment benefits) returning to pre-recessionary levels. Furthermore, leading indicators, economic forecasts and the relative lack of any obvious economic threats suggest a continuation of this improvement in the months ahead. This fairly rosy outlook is not a guarantee, of course, but rather a widely-held prediction in the face of an uncertain future.
Despite the length of our recovery and the jobs that we have regained, the severity of the recession and the often feeble nature of employment growth still leave us shy of a complete recovery.
While employment statewide and in many sectors continues to reach new highs, other sectors are still far short of where they were before the recession. Our unemployment rate has fallen to mid-2007 levels and continues to fall, but job opportunities are proving elusive for people of color, young adults with little or no experience, and those who have been without work for six months or longer. And while the top-level indicators show indisputable improvement, much evidence suggests that these improvements are accruing to a small segment of our population while leaving many groups behind.
Overall and child poverty rates, for example, remain at levels higher than before the recession. After-tax corporate profits as a share of gross domestic product (GDP) have set new records every year since 2010 (when they broke the 1929 record), while wages and salaries paid to workers are at their lowest as a share of GDP since record-taking began. So while our national and state employment situation has improved significantly since the recovery began in mid-2009, there remains much progress to make before we can start exchanging high-fives.
Looking forward, we also face challenges as baby boomers age, with nearly 500,000 current Minnesota workers hitting retirement age over the next 10 years. Over the past three years, Minnesota has seen its labor force grow by a mere 11,300, so what job growth we have seen has come about primarily by re-employing many of the 250,000 unemployed Minnesotans that the recession produced.
But as we approach full employment, additional job growth will be limited by an ever-decreasing rate of labor force growth, which the state demographer projects will increase by only 90,000 people between now and 2030. To put that in context, since the early 1990s we have consistently added more than 70,000 jobs a year, but now we're faced with the prospect of adding only 90,000 jobs over the next 15 years due to slow growth in the labor force.
This further underscores the need to remove the barriers to gainful employment that too many of our citizens face. If we are to mitigate the difficulties that a slowly growing labor force and economy will soon present, it is not too soon to start dealing with the challenges that confront people of color, people with disabilities, people with young children or elderly parents who need their care, people with out-of-date skills, people who have become detached from the workplace through prolonged unemployment, and the many others who find it difficult to pursue, locate or keep a quality job. Doing so will not only solve many of the problems that linger from the Great Recession, but it will also position us to overcome the significant challenges that lie ahead.
Last September, after four years of moderate but uneven job growth, Minnesota employment topped its pre-recession peak. Minnesota was the 15th state to recapture the jobs lost during the recession.
The state's job recovery, after the loss of 159,000 jobs, was initially stronger than the national job rebound in 2010 and 2011, but it has pretty much mirrored the national pace over the last 2-1/2 years. Because of stronger job growth coming out of the recession Minnesota reached its pre-recession employment peak seven months before the U.S. achieved that in May. Figure 1 shows job growth for Minnesota and the U.S. since 2001.
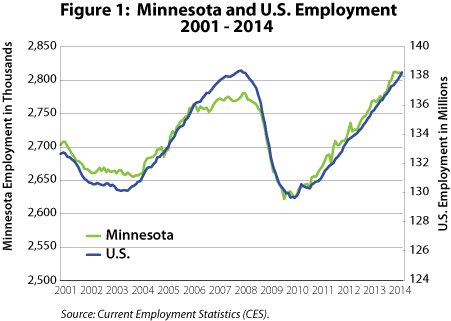
As of April, employment in Minnesota had expanded 7.1 percent since bottoming out in 2009, compared with 6.6 percent nationwide. Minnesota's advantage in job growth over the last four years can be attributed to a significantly smaller drop in public sector employment than in the U.S. public sector since the recession. Minnesota's public sector payroll is down 1.1 percent from its peak in 2010, while private sector payroll is up 8.2 percent from its trough in 2009. Public sector employment nationally is down 4.8 percent from its 2010 peak, while private sector payroll is up 8.6 percent from its 2009 trough.
Minnesota's private sector job growth was running right along with the national pace until the last few months. As Figure 1 displays, Minnesota's job growth has flattened out since the beginning of the year, with the state actually losing jobs since January. After adding 5,800 jobs per month on average during the last half of 2013, Minnesota has lost 1,000 jobs per month on average during the first four months of 2014.
Some of the soft patch in Minnesota's job growth may be revised away when benchmarking is carried out next year. Average monthly job gains for the first four months last year were initially reported at 2,300 but later revised up to 3,600.
Part of the job growth slowdown might be related to the state's severe winter and late spring, with cold temperatures and heavy snowfall affecting hiring. But the recent hiring slowdown was broad based, with six sectors averaging negative job growth over the first four months of the year. Even educational and health services has been losing jobs in 2014. Only two sectors, manufacturing and professional and business services, averaged higher job growth during the first four months of 2014 than in the last six months of 2013.
The pause in Minnesota job growth is surprising because most labor market indicators remain positive. Initial claims for unemployment insurance benefits have continued to fall this year, running 6 percent below last year's average. Job vacancies, as reported in the 2013 fourth quarter Job Vacancy Survey, were up 2.6 percent from a year ago, indicating that labor demand continues to climb. Weekly work hours also are up from a year earlier, as are average hourly wages.
Another positive indicator is the strong readings in the Minnesota Business Conditions Index. The index, reported since 1995, had its highest-ever January through April average this year. The solid signals from various labor market indicators point toward Minnesota's job picture rebounding from its winter doldrums.
Minnesota's employment expansion over the last year was, as usual, led by educational and health services, over 9,900 new positions. Manufacturing and construction were the two other leading job generators, with 6,700 and over 7,500 jobs added, respectively.
Despite being near the top in hiring over the last 12 months, manufacturing and construction employment remain far below pre-recession levels. Manufacturing employment is still down 21 percent from its peak, while construction jobs are 20 percent short of peak numbers. Neither sector is expected to exceed its historical peak employment levels over the next 10 years.
Four other sectors, as of April, are also still below pre-recession employment levels. Trade, transportation and utilities and financial activities are expected to regain all the jobs lost during the recession within the next few years. Government employment is also expected to top its record high, but not for another five years. Information employment, which has been declining for more than a decade, will likely continue to shrink, but the pace will be slower than during the recession.
Table 1 compares Minnesota and U.S. job growth across sectors over the last year. Job growth in the state has slipped slightly behind the national pace, with six of the 11 sectors adding jobs faster in Minnesota than nationally. The faster-growing sectors in Minnesota, however, are higher-paying sectors, which has helped boost income growth in the state relative to the nation. Minnesota's wage and salary income increased 3.3 percent between the fourth quarters of 2012 and 2013, compared with 2.1 percent growth nationwide.
| Annual Employment Growth, April 2014 (not seasonally adjusted) | ||
|---|---|---|
| - | Minnesota Percent | U.S. Percent |
| Total Nonfarm | 1.5 | 1.7 |
| Total Private | 1.7 | 2.1 |
| Mining and Logging | 3.5 | 5.7 |
| Construction | 8.0 | 3.5 |
| Manufacturing | 2.5 | 0.9 |
| Trade, Transportation, and Utilities | 1.2 | 2.1 |
| Information | 0.8 | -1.3 |
| Financial Activities | -0.7 | 0.7 |
| Professional and Business Services | 1.5 | 3.6 |
| Education and Health Services | 1.9 | 1.6 |
| Leisure and Hospitality | 1.8 | 2.8 |
| Other Services | 1.0 | 1.0 |
| Government | 0.4 | 0.0 |
| Source: Current Employment Statistics (CES) | ||
While all regions in Minnesota are experiencing a job rebound since the recession, the pace of the rebound has been slower in northeastern and southwestern Minnesota. Figure 2 compares wage and salary employment during the third quarter between 2006 and 2013 across regions. Regional employment totals are normalized to employment levels during the third quarter of 2007. The recession hit central Minnesota and the Twin Cities the hardest, with job losses near 6 percent. Both of these regions are close to recapturing the jobs lost.
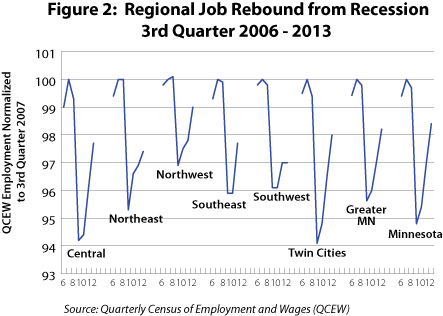
Northwestern Minnesota's job losses were the smallest during the recession, enabling the region to become the first to exceed its pre-recession employment peak. Both the northeastern and southwestern parts of the state still have some work to do before employment recovers to pre-recession levels.
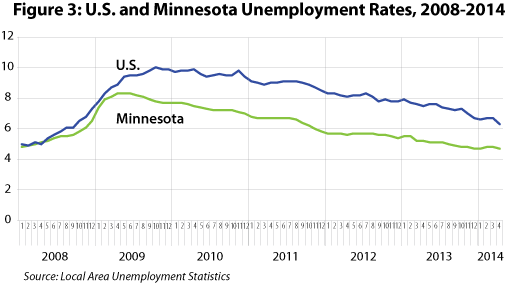
Minnesota's unemployment rate has been significantly below the national rate since early in the recession. In mid-2009 Minnesota peaked at 8.3 percent (seasonally adjusted), while the U.S. rate continued to increase until it peaked at 10 percent in late 2009. Since then, Minnesota's unemployment rate has remained about 2 percent lower than the national rate, with both declining in concert. In recent months, however, Minnesota's unemployment rate has leveled off, while the U.S. has continued to trend downward.
In January 2014 the Minnesota-to-U.S. unemployment rate gap fell below 2 percentage points (to 1.9) for the first time since 2009. In April, it further decreased to 1.6 percent, as Minnesota's seasonally adjusted unemployment rate hit 4.7 percent and the U.S. unemployment rate fell to 6.3 percent (see Figure 3).
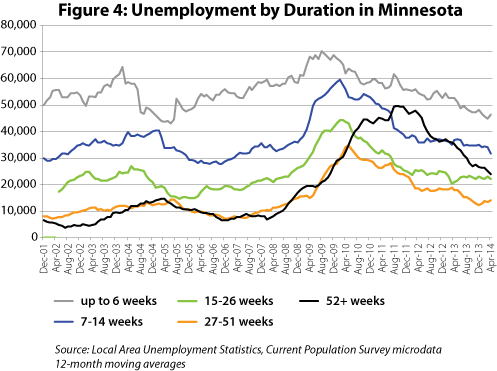
The unemployment picture in Minnesota has continued to improve on other fronts. Between April 2010 and June 2013, the number of long-term unemployed - people out of work 27 weeks or longer - was the largest share of all unemployed. Only in the last few months has the number of people unemployed six weeks or fewer - historically the largest category - surpassed the long-term unemployed.
The number of long-term unemployed didn't peak until August 2011 and lingered at nearly 50,000 until June 2013, staying well above the 15,000 mark that was typical through most of the last decade. The number of long-term unemployed is now down to 37,900 and declining rapidly (especially those unemployed longer than 52 weeks) as the other groups of unemployed workers taper more gradually (see Figure 4).
Unfortunately, some of these declines are created as people drop out of the workforce. In Figure 5, the official number of unemployed workers - those not working who want to work, are available to work and actively looking for work - has fallen back down to 2008 levels.
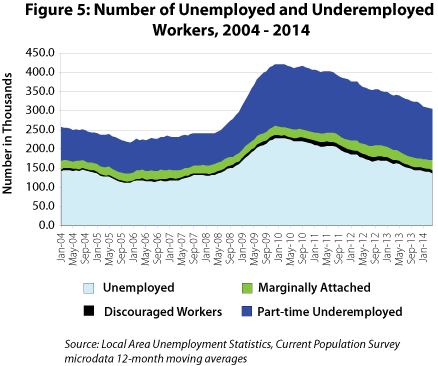
The number of discouraged workers (those who have given up looking because they don't believe jobs are out there) and the number of marginally attached workers (those who have worked or looked for work in the last year but not actively enough to qualify as unemployed) both remain slightly elevated over 2008. The number of part-time underemployed workers (those who are working part time because they couldn't find full-time work) remains significantly higher than before the recession, however.
Job vacancies have rebounded since the Great Recession, reaching more than 60,000 during fourth quarter 2013 in Minnesota. But has the quality - hours and wage offers - of these vacancies rebounded as well?
The only information on hours is from share of part-time versus full-time vacancies. The share of part-time vacancies ranged from 34 to 45 percent (averaging 39 percent) between 2001 and 2013. Before the Great Recession, which started in fourth quarter 2007, the share of part-time vacancies averaged 37.9 percent. The share of part-time vacancies increased during the recession, averaging 40.4 percent. Since then, part-time vacancies have remained high, averaging 40.8 percent since the end of the recession. Overall, full-time jobs are still more difficult to find since the recession than they were between 2001 and 2007.
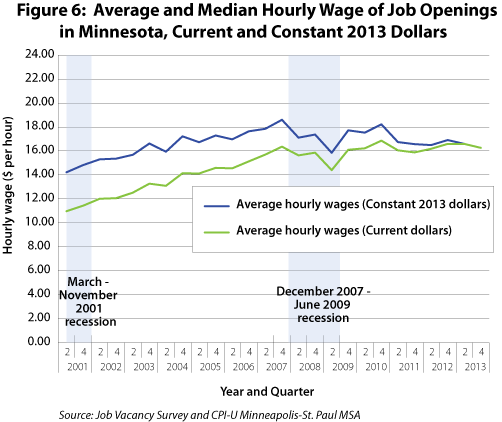
Average wage offers1. are another important measure of job quality. In this article, average wage offers are presented in nominal (current dollars) and real (constant 2013 dollars) terms.2
Statewide, both average nominal and real wage offers climbed steadily from 2001 to the start of the recession and then fell throughout the recession (see Figure 6). They climbed back up to near pre-recession highs shortly after the recession but dropped down in 2011 and have leveled off since. Overall, average real wage offers grew 9.7 percent between fourth quarter 2001 and fourth quarter 2013, or about 0.8 percent a year on average. Average real wage offers, however, have declined 12.6 percent since peaking at $18.60 during fourth quarter 2007 to $16.26 in fourth quarter 2013.
As Figure 7 shows, the seven-county Twin Cities pattern has been similar to the statewide pattern. Average wage offers in Greater Minnesota have remained consistently below those of the Twin Cities. In fourth quarter 2013, the average wage offer in Greater Minnesota was $14.11 compared with $18.02 in the Twin Cities. Moreover, average real wage offers in Greater Minnesota have shown a somewhat flatter pattern than in the Twin Cities, climbing 10.6 percent compared with 12.8 percent in the Twin Cities between the fourth quarters of 2001 and 2013 in constant 2013 dollars.
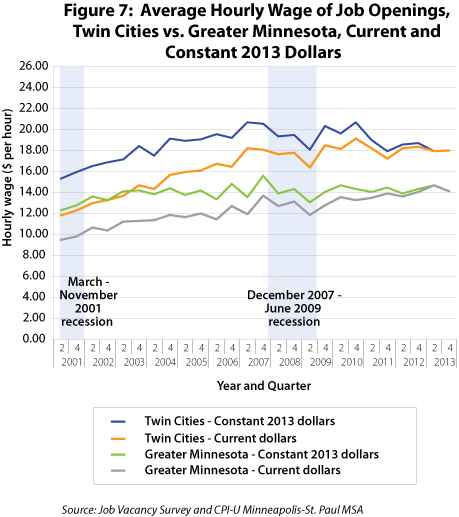
There are many underlying forces at work in Figures 6 and 7. Some are intrinsic to job vacancies, such as education and experience requirements. Some are structural, such as occupational and industrial shifts. Still others are institutional, such as increases in the minimum wage during 2007-2009.
It is plausible that all these forces are correlated with each other, making it difficult to isolate the net effect of each force. To develop an appreciation of how these forces are related to the structure of wage offers over time, we only consider in this article the behavior of the distribution of educational requirements for job vacancies over time.
Educational requirements show two opposite tendencies. First, during non-recession years, they are part of the explanation for differences in average wage offers over time. For example, the share of vacancies requiring post-secondary education was lower in fourth quarter 2013 than any time since 2004, as Figure 8 shows. This at least partly explains why average wage offers decreased in real terms between fourth quarter 2012 and 2013, despite an improved labor market as measured by the ratio of vacancies to unemployed job seekers.
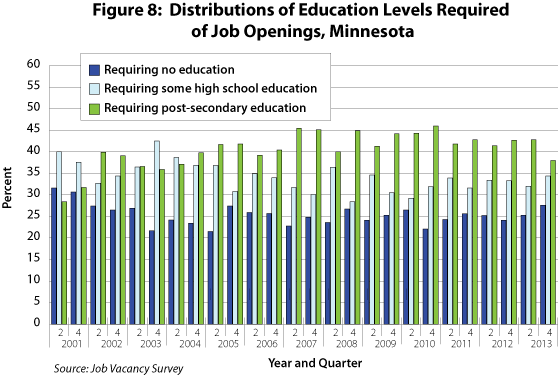
In addition, the upward trend in average wage offers between 2001 and 2007 can be partly explained by an upward trend in the share of vacancies requiring post-secondary education. The share of vacancies requiring post-secondary education increased from 28.4 percent in second quarter 2001 to 45.5 percent in second quarter 2007. Similarly, the flattening in average wage offers since 2011 seems to be associated with a flattening of the share of vacancies requiring post-secondary education. Finally, job vacancies in fourth quarter 2010 exhibited the highest share of vacancies requiring post-secondary education at 46 percent and the highest average nominal wage offer since the start of the data series in 2001.
Figure 8 also illustrates the tendency of employers to inflate educational requirements of vacancies during slack labor market periods. Before the recession, the share of vacancies requiring post-secondary education averaged 39.7 percent, but during the recession they averaged 42.8 percent even as the average wage offer steadily fell during those quarters.
On a year-over-year basis, Minnesota's job growth averaged 1.6 percent during the first four months of 2014, which is right in line with the 1.5 percent pace expected in 2014. That growth will be Minnesota's fourth consecutive year of solid job gains, providing the state with its best four-year run in that category since 1997-2000. Overall, the Minnesota economy is forecast to generate 42,000 wage and salary jobs in 2014, down slightly from the 46,000 jobs added last year.
Most labor market indicators remain positive, pointing toward another year of steady employment expansion. Initial claims for unemployment benefits have fallen to pre-recession levels, while job vacancies have climbed to their highest total since 2005. All sectors are anticipated to expand employment in 2014, producing another year of broad-based growth.
Hiring is expected to accelerate in construction and manufacturing while slipping slightly in financial activities, professional and business services, and educational and health services. Goods-producing sectors will account for slightly more than one in four new jobs in 2014. Employment in construction and manufacturing, however, will remain far below pre-recession levels, despite the expected uptick in hiring.
Minnesota's unemployment rate, which had been trending downward faster than the national rate since the end of the recession, has been stuck between 4.6 to 4.8 percent for the last seven months. This is actually a good sign because it is being driven by expanding labor force participation. The labor force participation rate had been sliding since the recession, but it started to climb over the last few months, boosting Minnesota's labor force to more than 3 million workers for the first time.
Minnesota's labor market has rebounded to the point where workers who dropped out of the labor force over the last five years are now beginning to return. A recent uptick in household employment is another encouraging development. Household employment, which includes self-employment, has been increasing at its fastest pace since 2011.
1Average wage offers are used here instead of median wage offers to better illustrate change in wage offers over time. The job vacancy survey sample is constructed to estimate point-in-time data rather than time series data. Normally median wage offer is a better representation of point-in-time data (one quarter of data) as it protects against the distortive effects of extremely high wage offers. However, using job vacancy survey statistics in a time-series analysis gives rise to what is known as a "composition effect." This effect can occur as a result of changes in the distribution of job vacancies between industries, changes in the occupational distribution of job vacancies, and changes in the proportion of full time and part time. Although both median and average wage offers are expected to be influenced by this effect, the average wage is a better measure to illustrate comparisons over time.
2Average real wages represent average nominal wages adjusted for inflation and are expressed here in terms of prices prevailing in 2013.