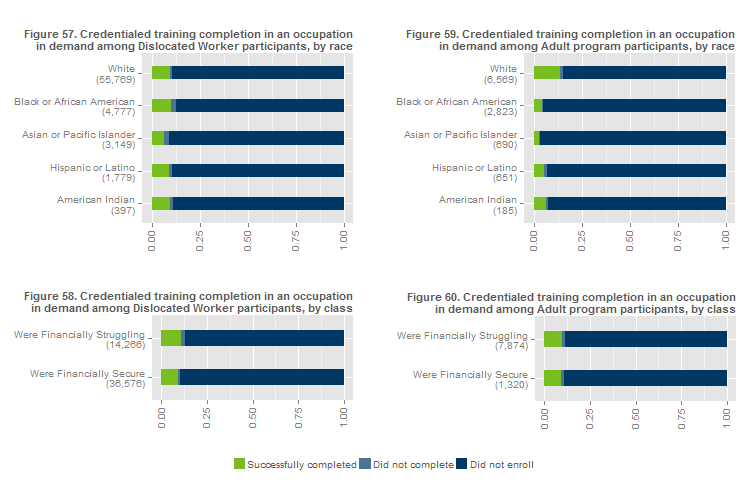
Figure 57 through 60 show credentialed, classroom training completion in an occupation in demand (OID).

Due to data inaccuracies, the true rate of training in an OID is likely higher (see Appendix). However, we have no reason to believe that there are systematic data inaccuracies by class or race of the participant; therefore the pattern should hold true even if the overall rate is low (See Note 1).
Rates of credentialed, classroom training in an occupation in demand are roughly equal by race and class (around 10 to 15%) among Dislocated Worker participants (Figure 57 and Figure 58). Rates by class among Adult program participants are likewise roughly equal (again between 10 and 15%) (Figure 60). Rates by race among Adult program participants vary much more, from a high of 19% among white participants to a low of 4% among Asian or Pacific Islander participants.